Data Visualization
19 articles
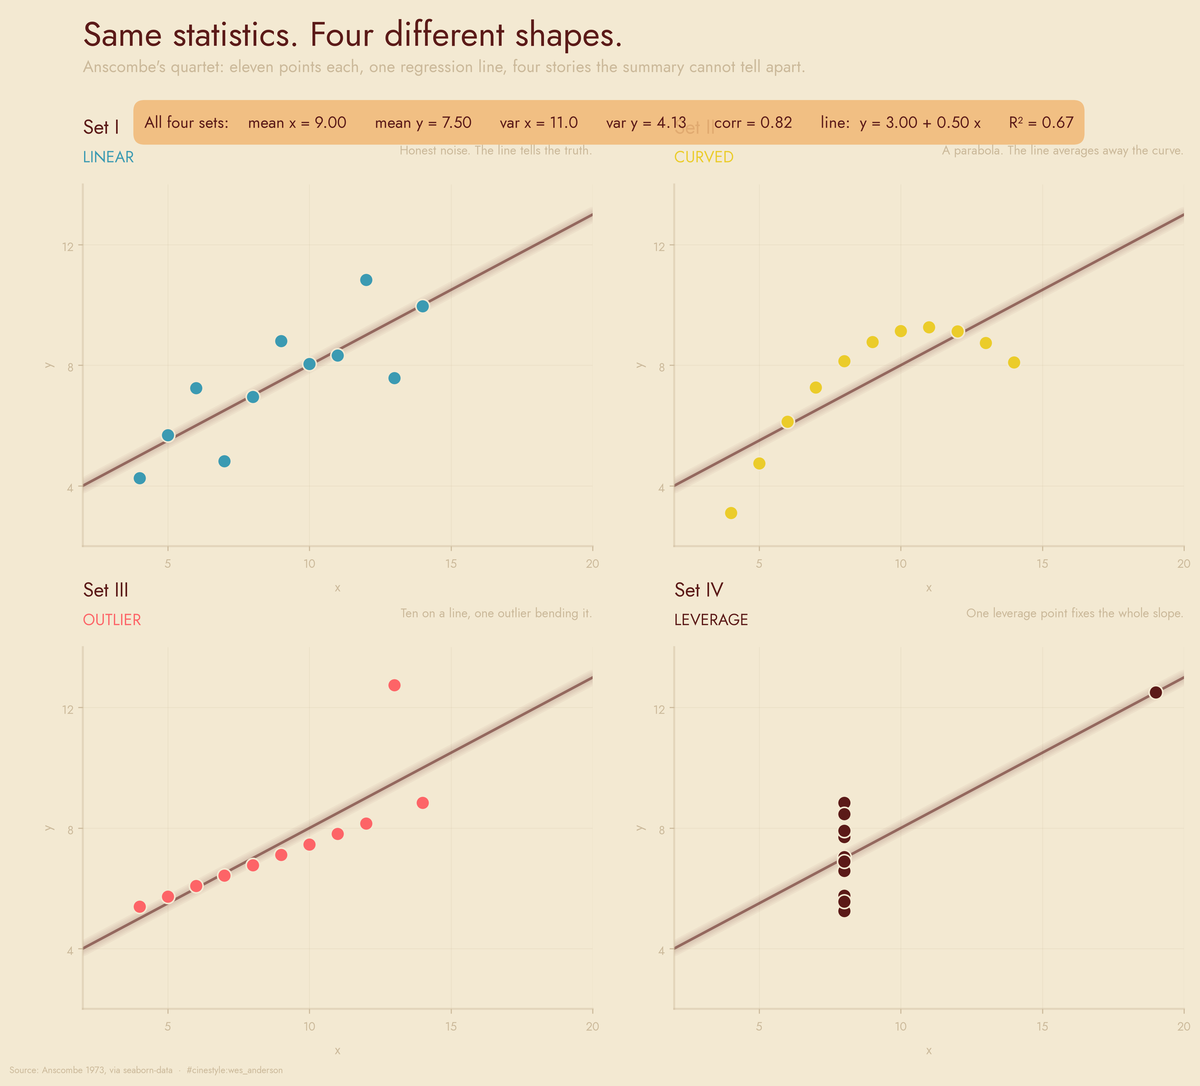
Anscombe's Quartet
Four datasets agree on every number and agree on nothing else
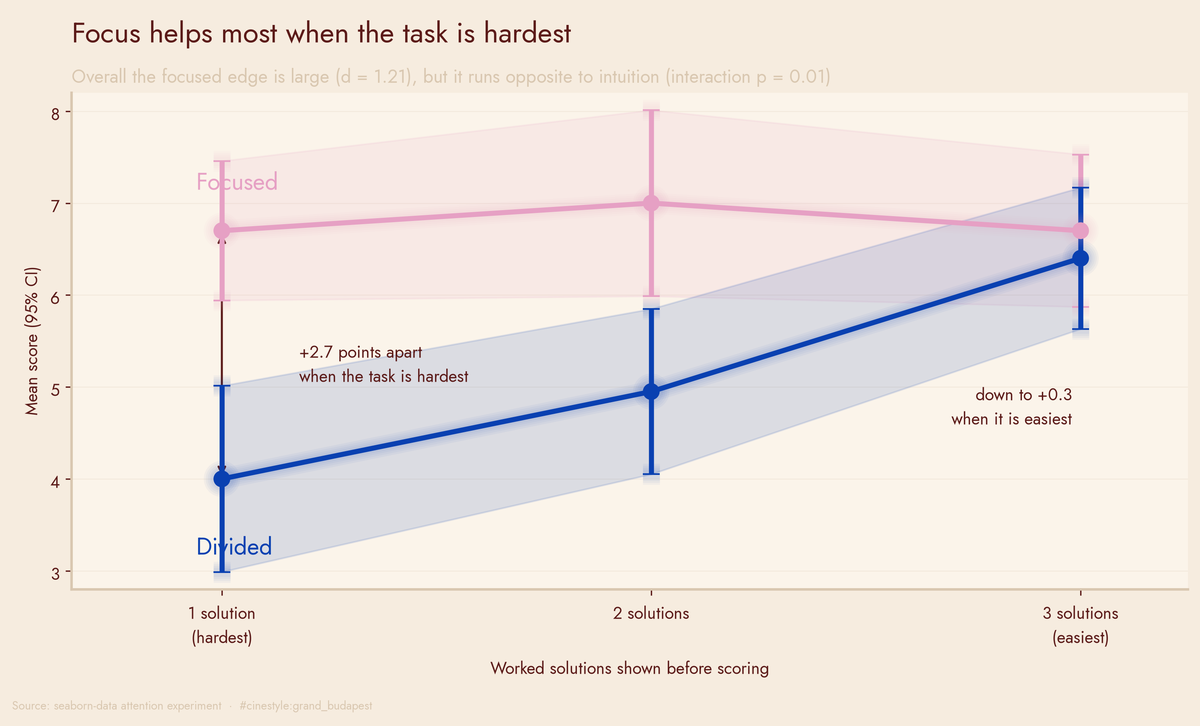
Attention and Performance
Focused attention wins by 1.68 points, until the task gets easier
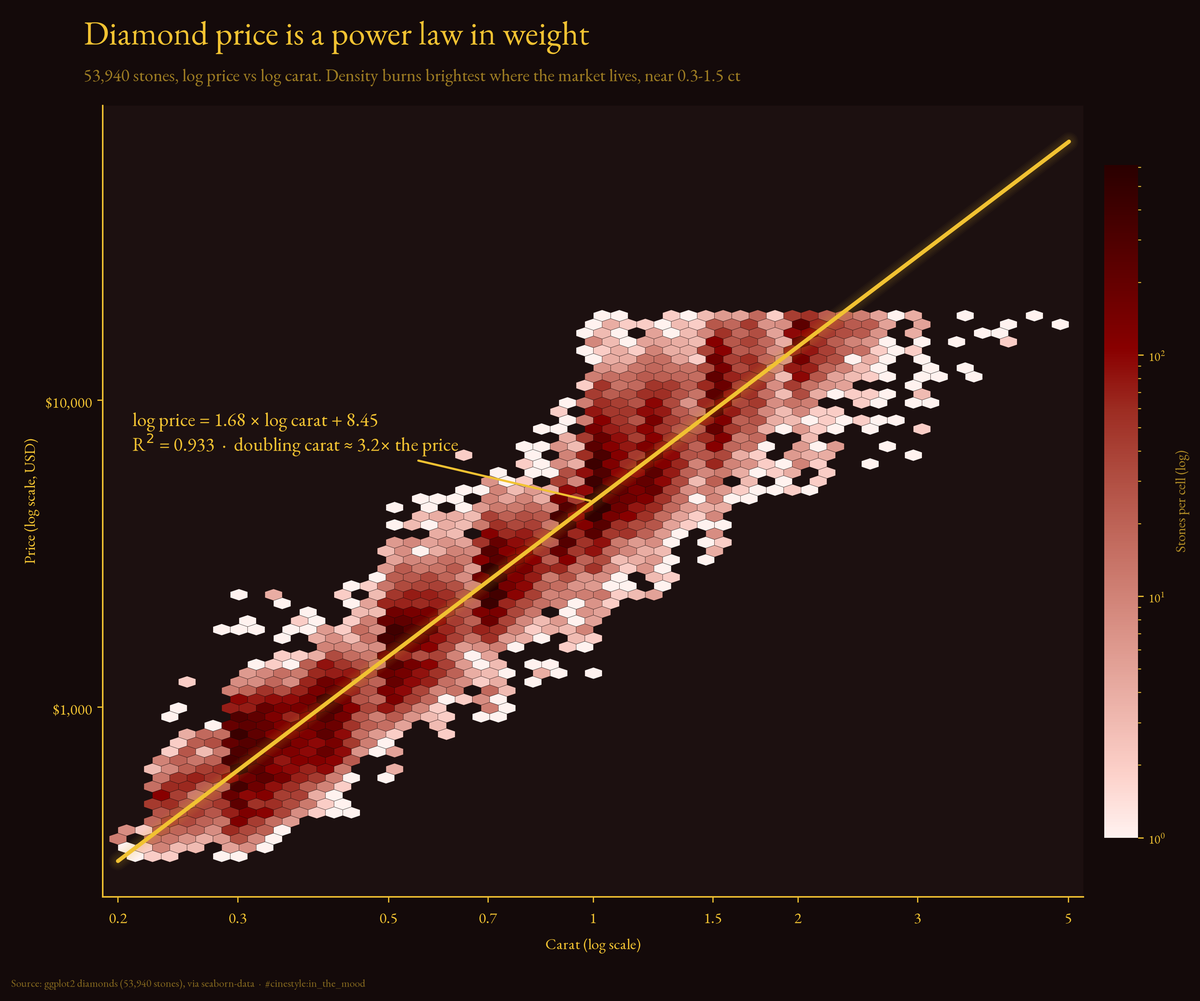
Reading Diamond Prices
The best-cut diamonds are the cheapest, and other lies the data tells
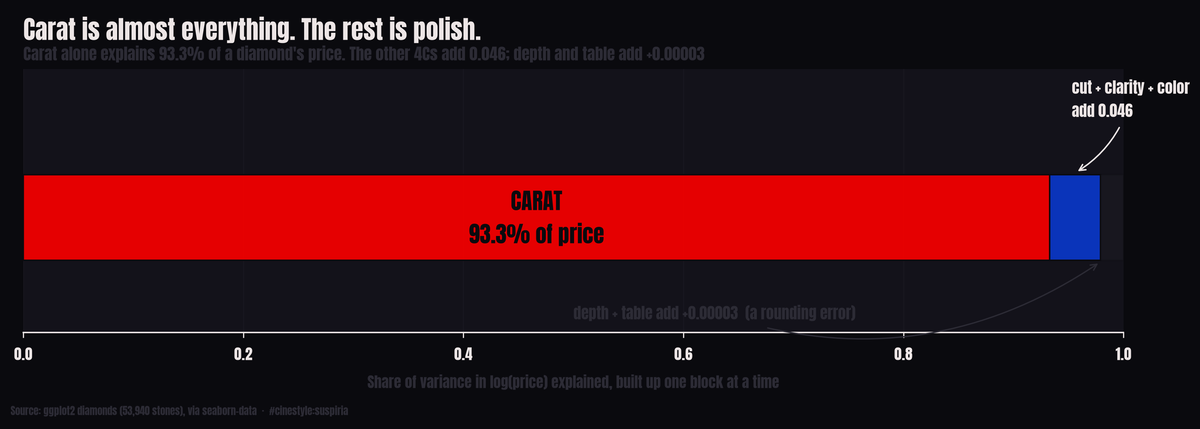
A Diamond's Four Cs
Two of a diamond's measurements are basically decoration
Evidence and Perception
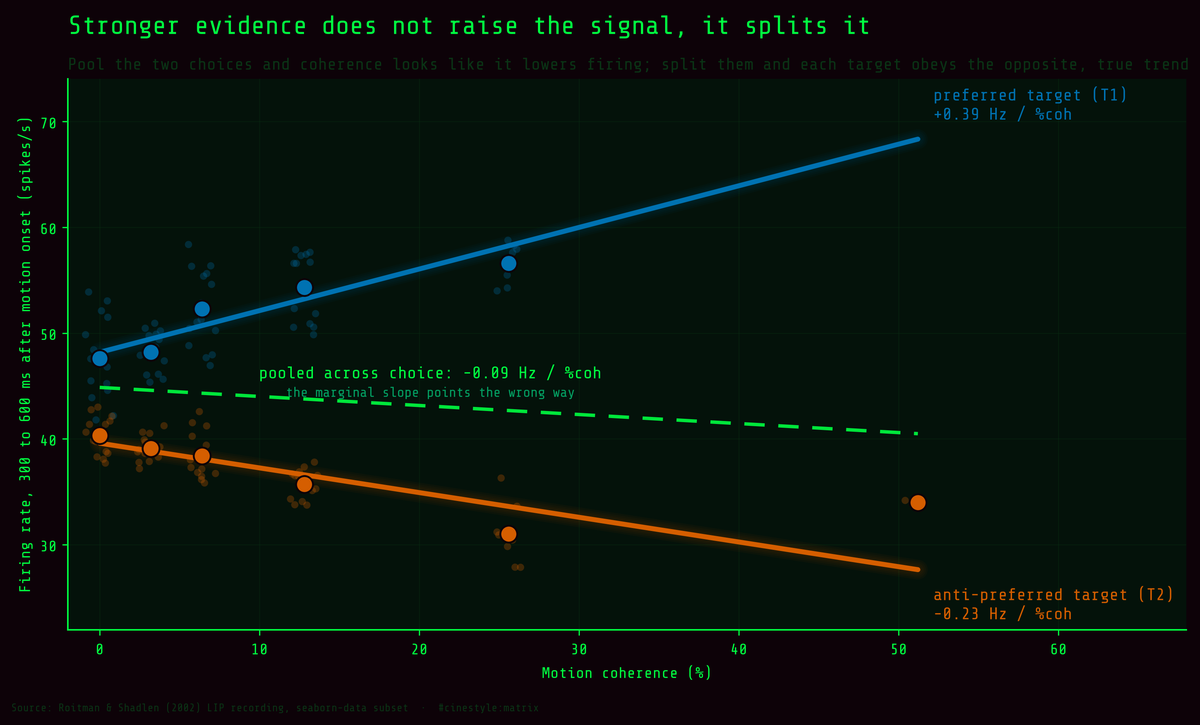
Stronger evidence does not raise the signal; it splits it
fMRI Response Curves
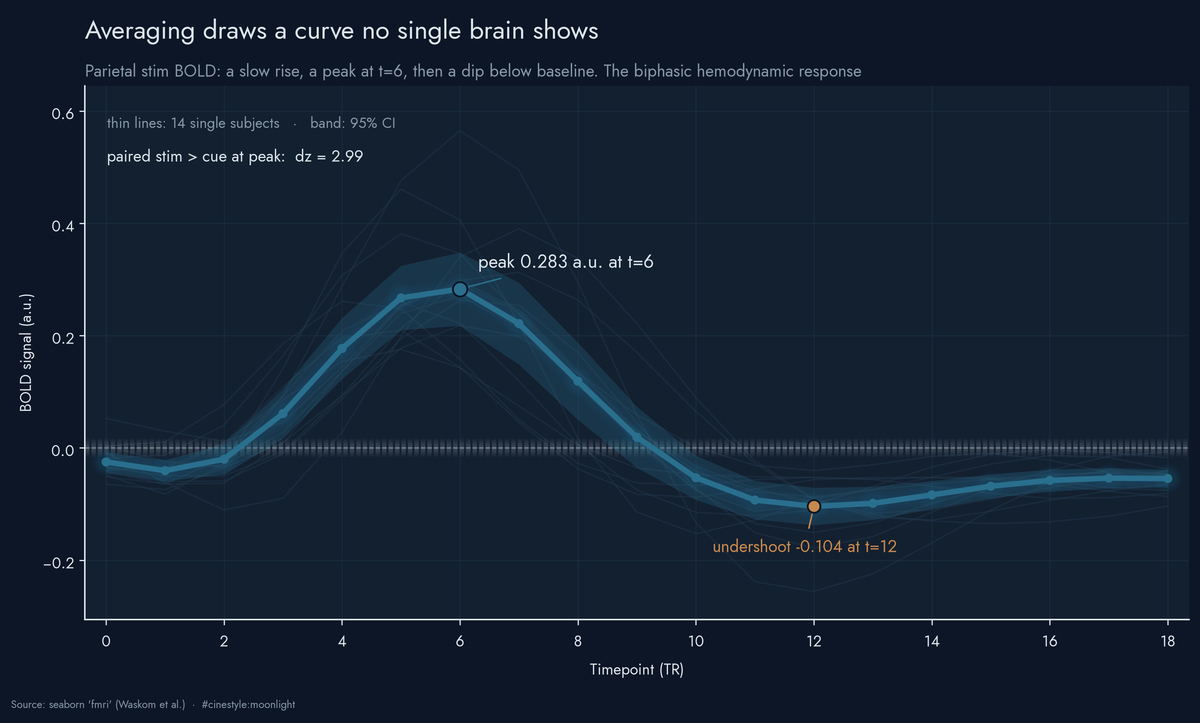
The average brain response is a curve, and averaging is what draws it
Lessons from 30 Datasets
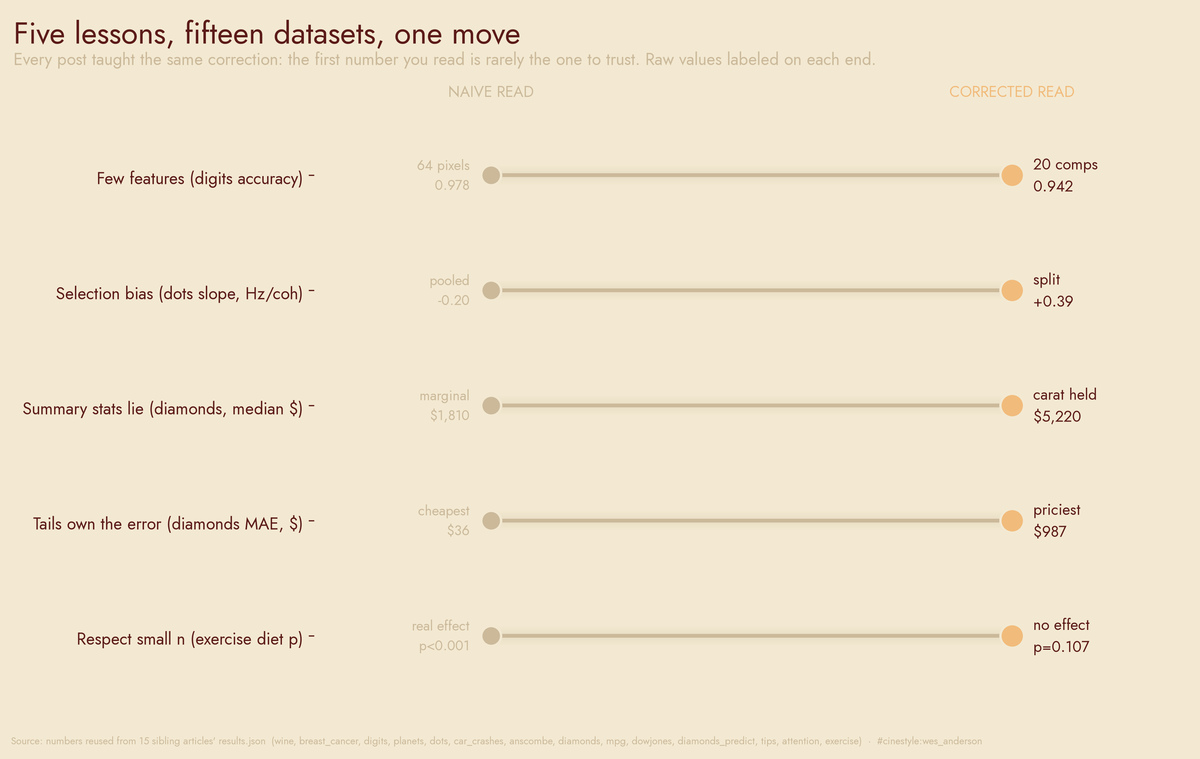
Three numbers off a wine label, and four other things 30 datasets taught me
The MPG Paradox
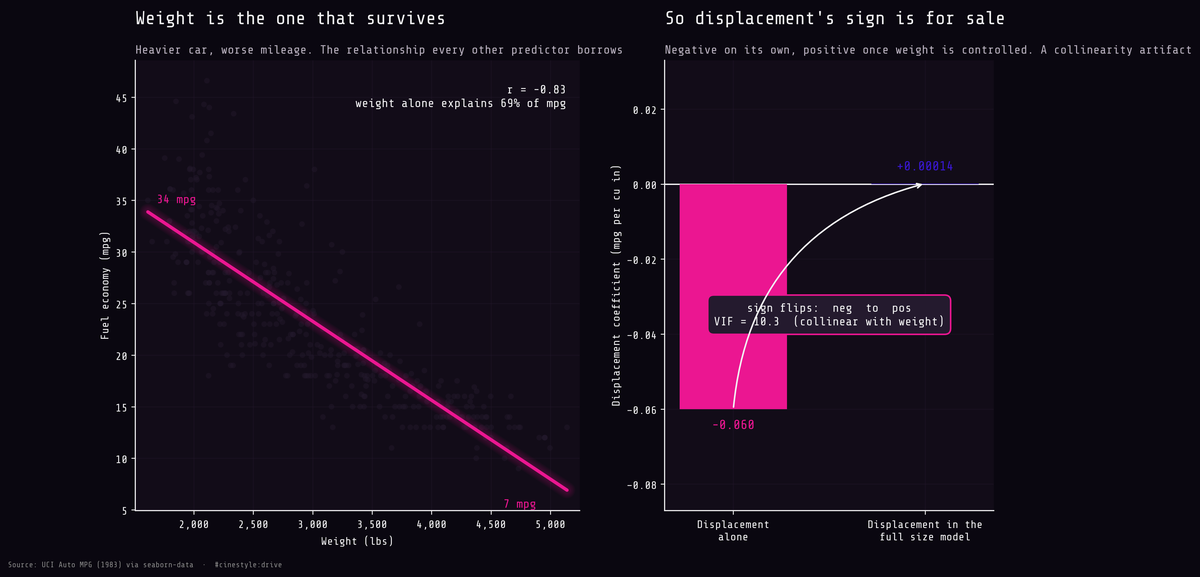
A bigger engine made these cars more efficient, and other lies of regression
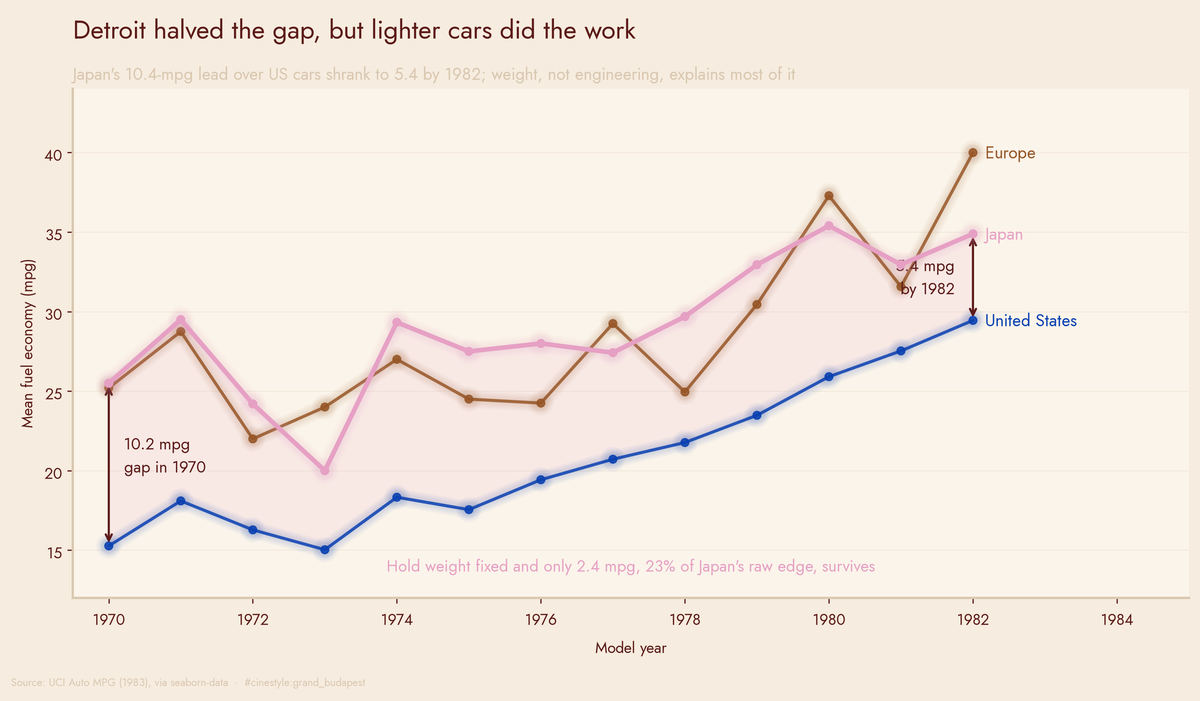
Detroit Versus Japan
Detroit caught up to Japan, but only after you weigh the cars
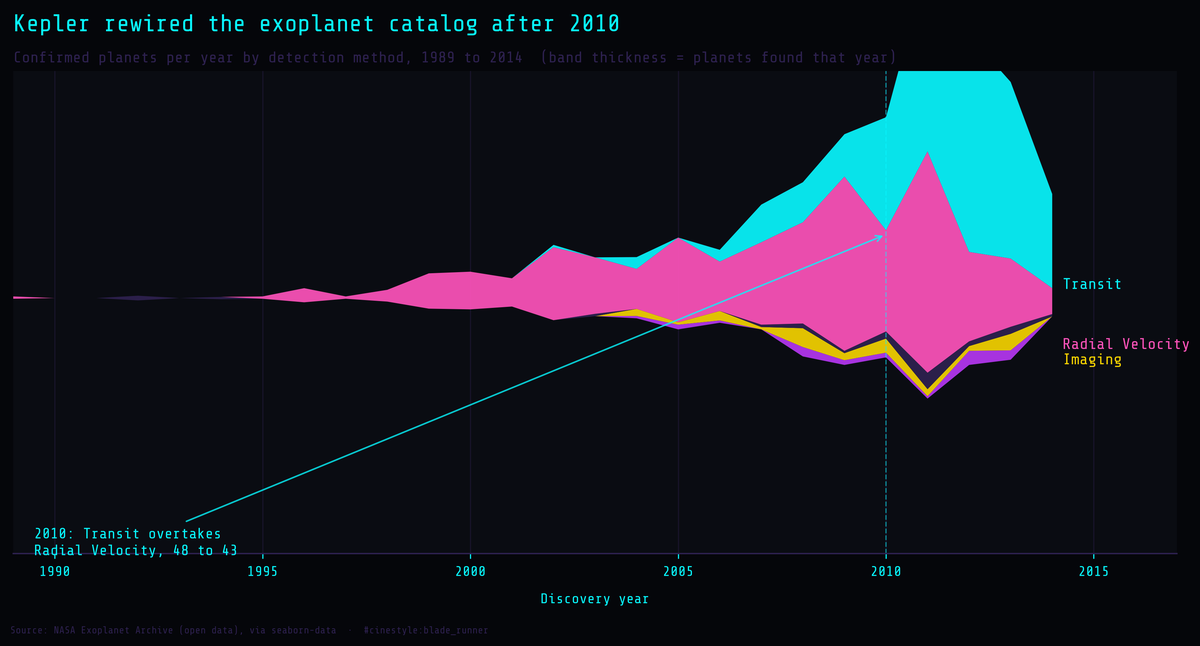
Mapping the Exoplanets
The exoplanet catalog is a map of our telescopes, not the galaxy
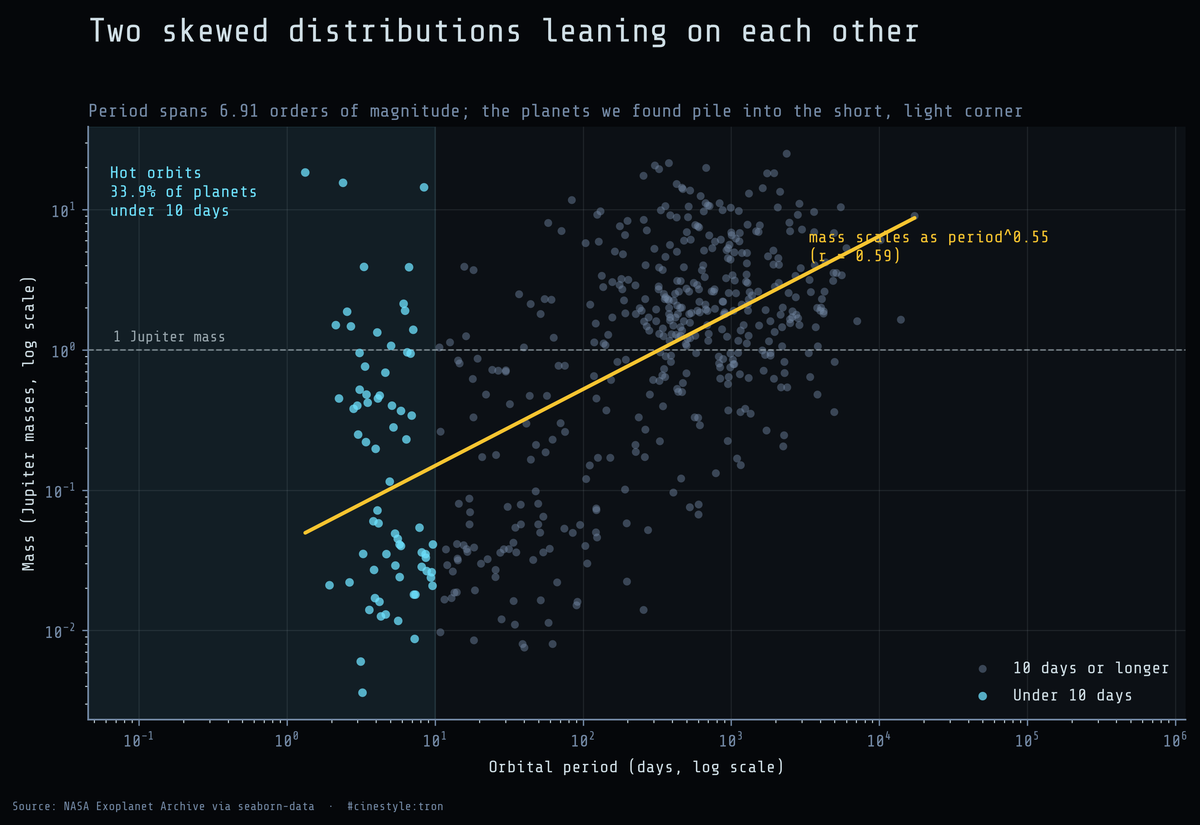
How Exoplanets Cluster
Almost seven orders of magnitude, and the planets pile up at one end
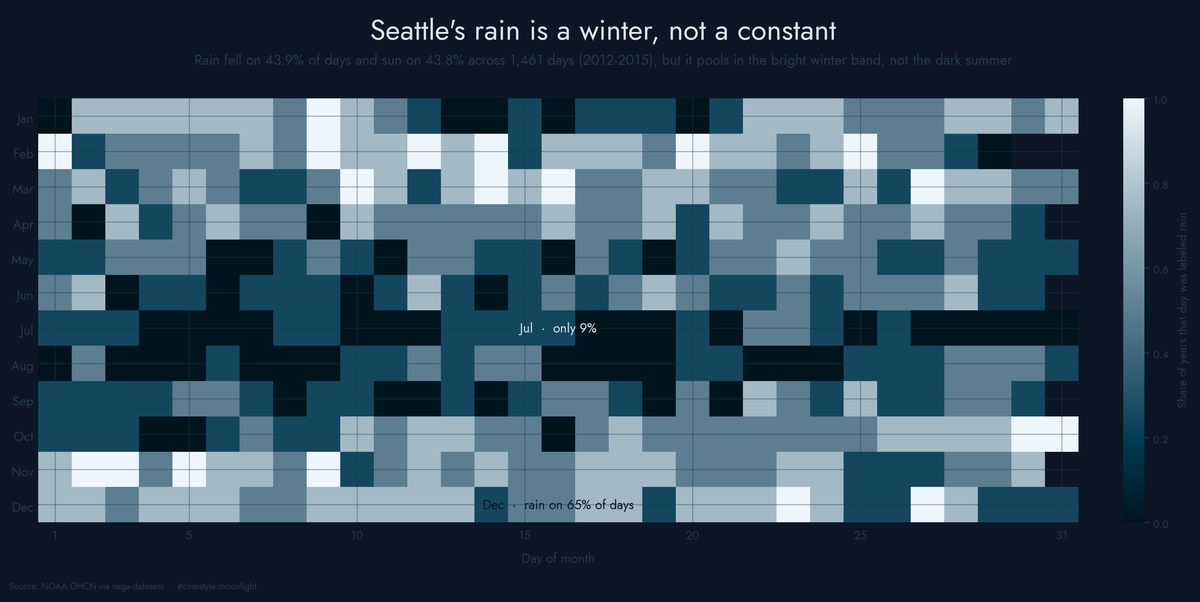
Seattle's Weather
Seattle rains on 43.9% of days. It is sunny on 43.8%.
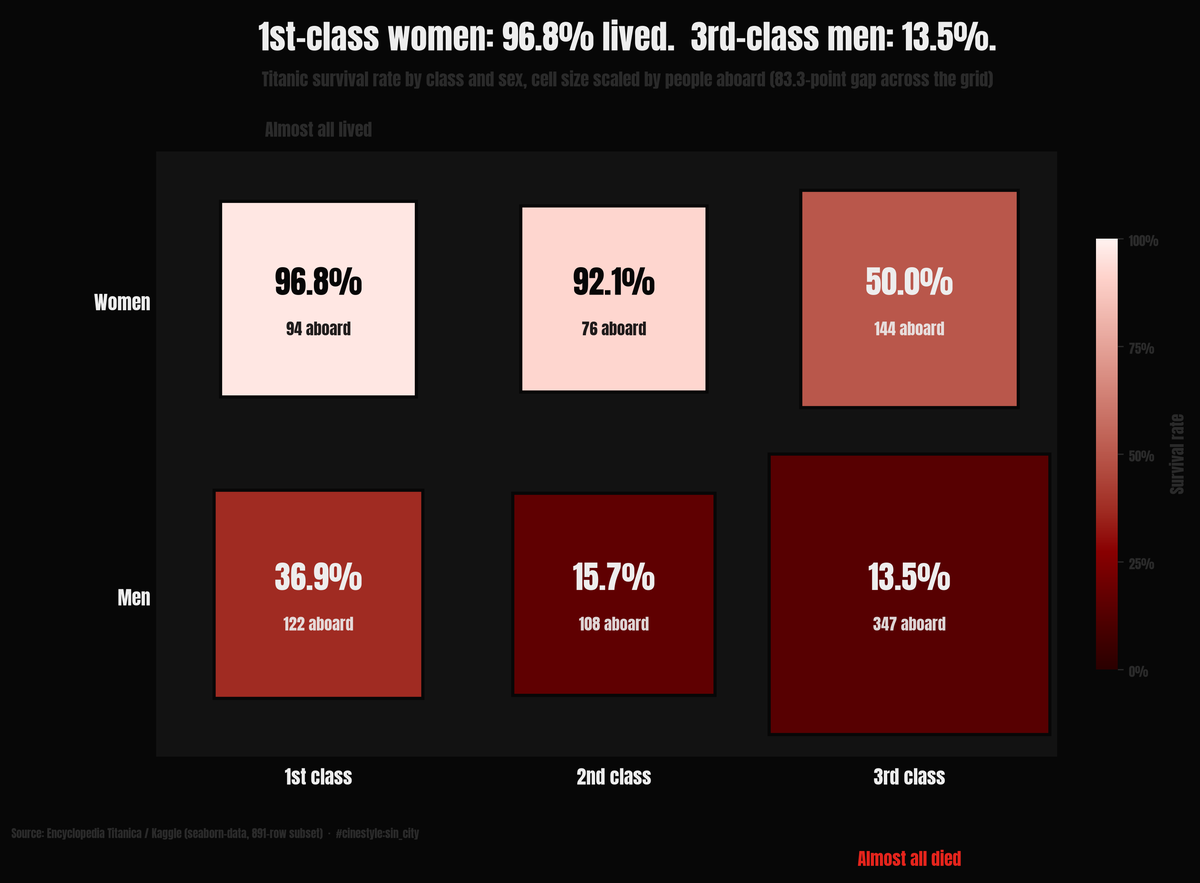
Who Survived the Titanic
Women and children first, or first class first?
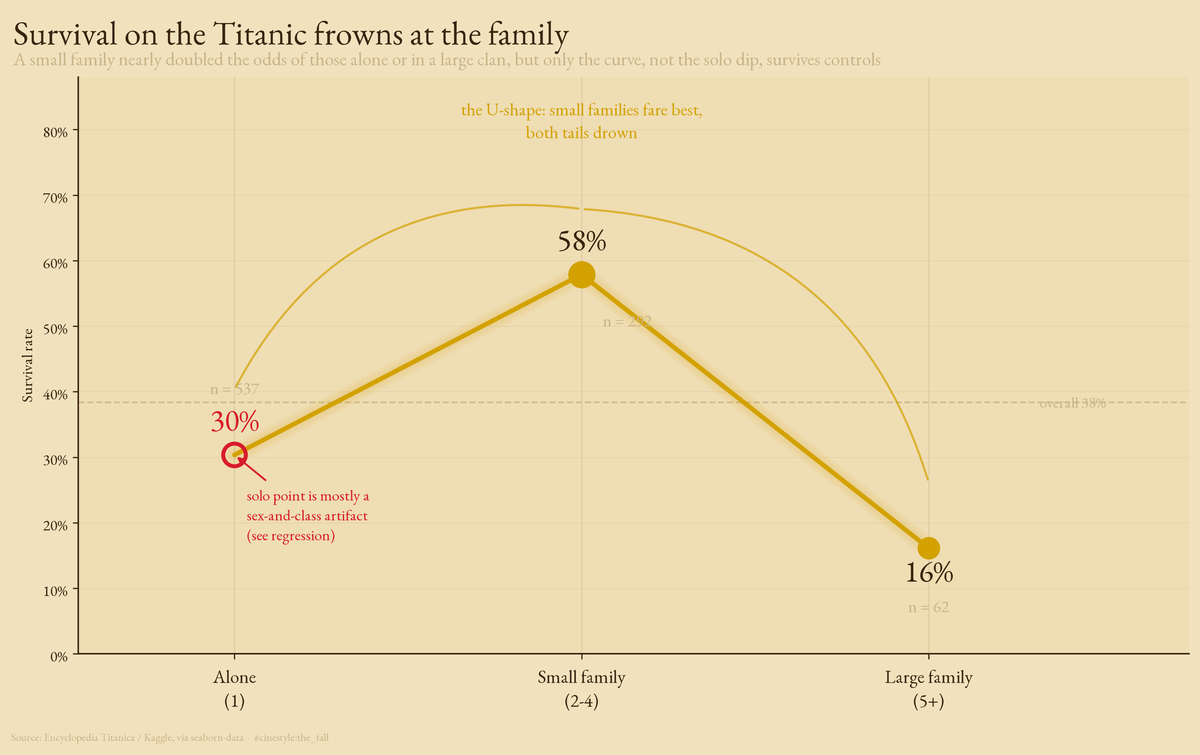
Titanic Families
The Titanic's loneliest passengers, and its largest families, drowned together
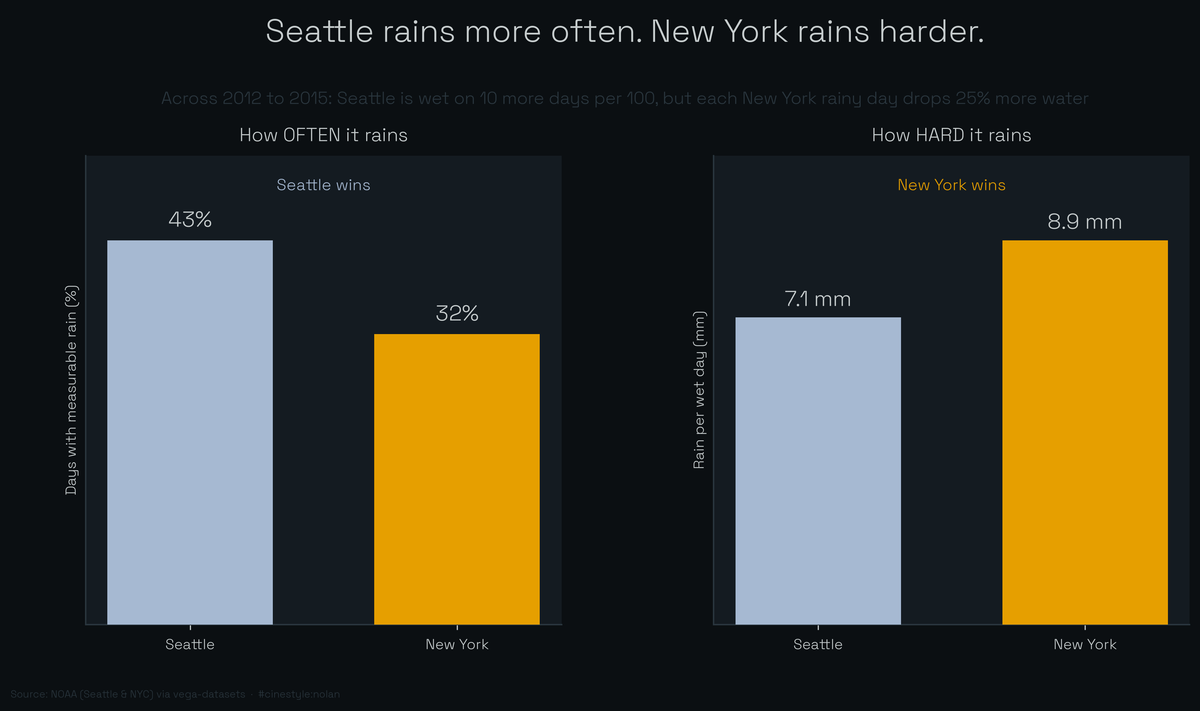
Seattle Versus New York
Seattle rains on 10 more days out of every 100 than New York, and New York's rain falls harder
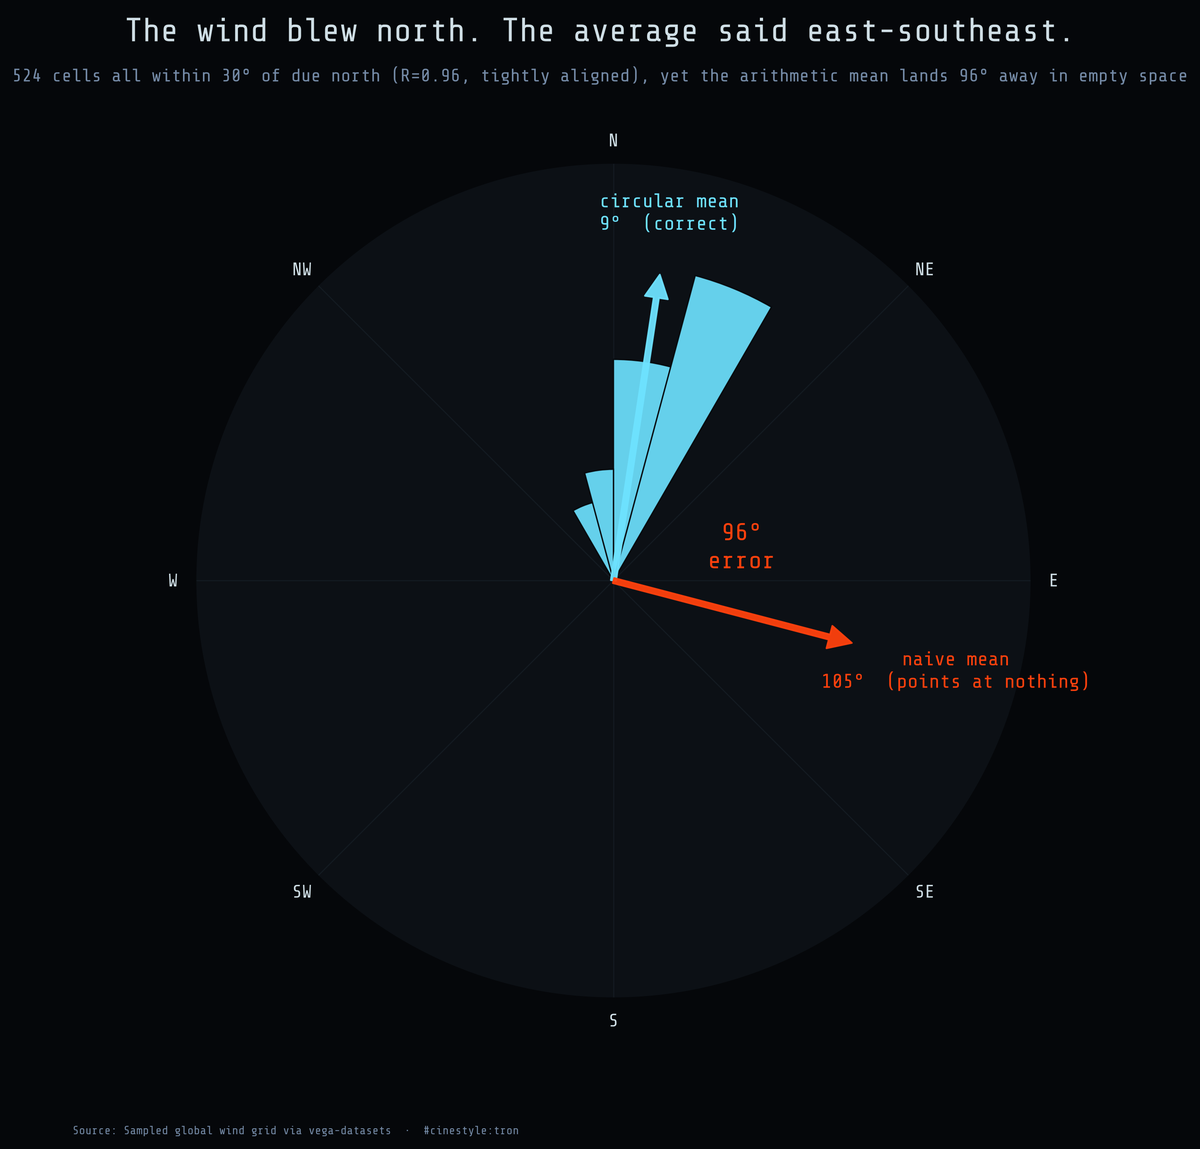
Averaging the Wind
The wind blew north. The average said east-southeast.
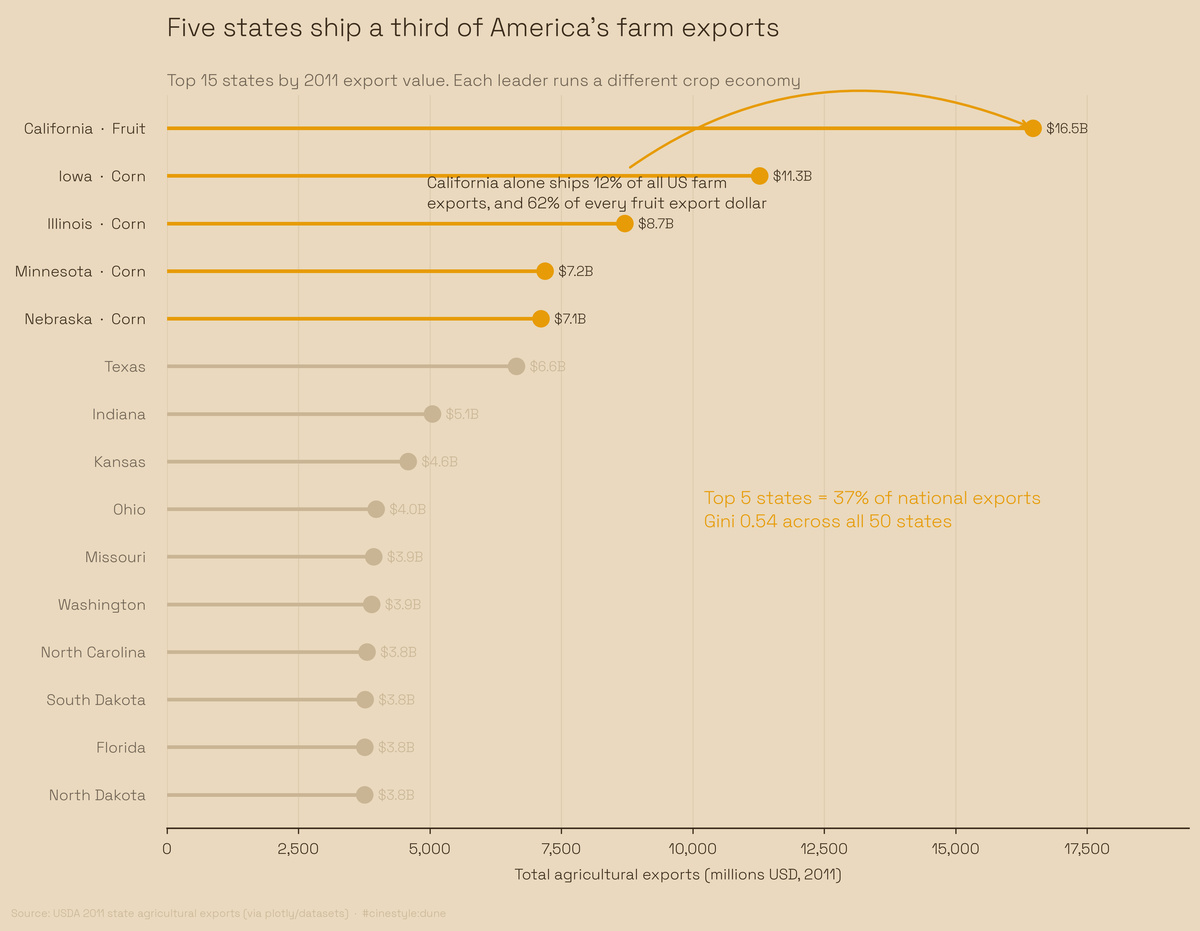
America's Farm Exports
Five states ship a third of America's farm exports, and none of them grow the same thing
Cinestyle: matplotlib themes pulled from film
A small Python library of matplotlib themes — Film Noir, Ghibli, Wes Anderson, Blade Runner, Star Wars — applied to 50,000 IMDB reviews.
WebAssembly visualization with Rust: when JavaScript runs out of room
Building browser-side data visualizations in Rust compiled to WebAssembly — particle systems, large-dataset rendering, and the practical wins over a pure-JS implementation.