// article
Mapping the Exoplanets
The exoplanet catalog is a map of our telescopes, not the galaxy
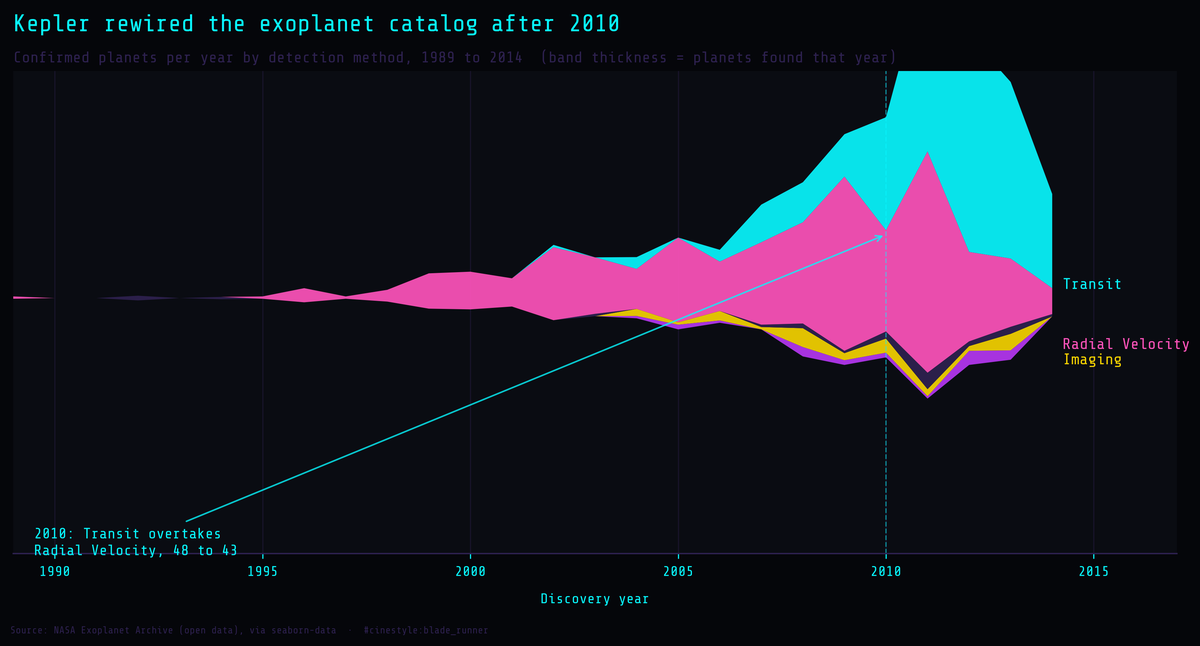
Start with the chart. For two decades the catalog is a thin magenta thread of Radial Velocity detections. Then Kepler comes online, and after 2010 a cyan Transit band swallows the field. The band’s thickness is just the count of planets found that year, so what you are watching is our instruments changing, not the sky.
In 2010 the count flipped for the first time. Transit detections outnumbered Radial Velocity in a single year, 48 to 43. The lead would seesaw for another year before Transit kept it, but 2010 is where the catalog started turning from a Radial Velocity story into a Kepler story. We pointed a different instrument at the sky, and a different kind of planet started showing up.
I went into this dataset expecting a sky survey. What I found is closer to a survey of our hardware.
The data
I am using the planets table from the NASA Exoplanet Archive, via seaborn-data: 1,035 confirmed planets discovered between 1989 and 2014. Six columns: detection method, planet number in its system, orbital period (days), mass (Jupiter masses), distance (parsecs), and discovery year. It is a dated snapshot. It stops right as Kepler’s haul was still being confirmed, so read everything here as the world up to 2014, not today.
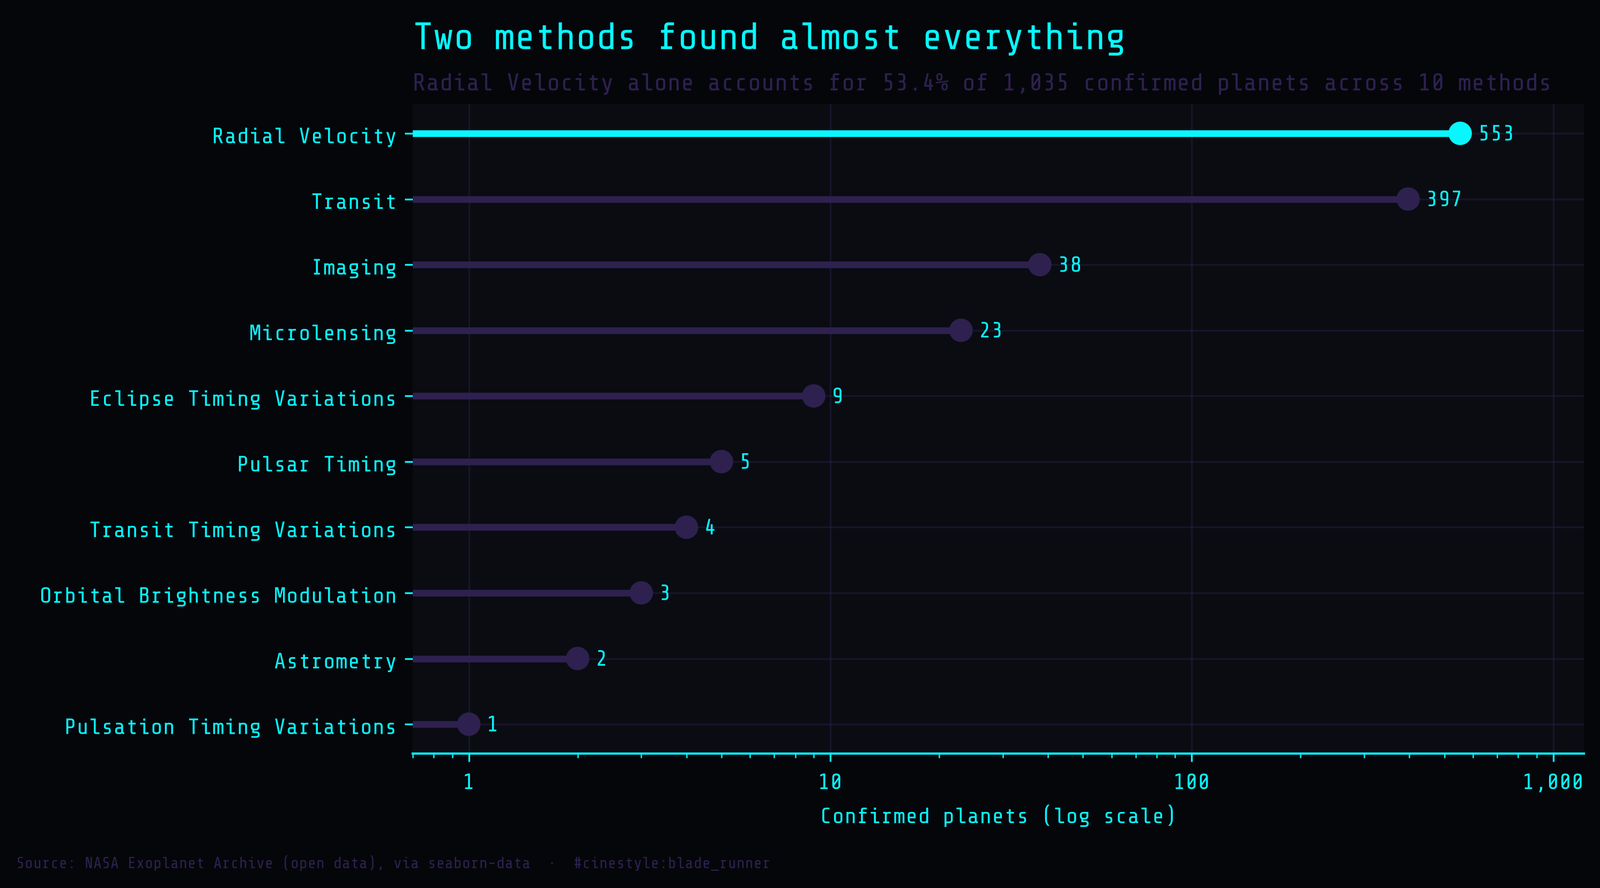
Two methods carry almost the whole catalog. Radial Velocity accounts for 553 planets (53.4%), Transit for 397. After that it falls off a cliff: Imaging 38, Microlensing 23, and a long tail of timing methods in the single digits. Ten methods total, but the six smallest together found fewer planets than Imaging alone.
The handoff
Radial Velocity watches a star wobble as a planet tugs it back and forth. It got there first and dominated for two decades. Transit watches a star dim as a planet crosses in front of it. It is cheap to do at scale once you have a space telescope staring at one patch of sky, which is exactly what Kepler did after its 2009 launch.
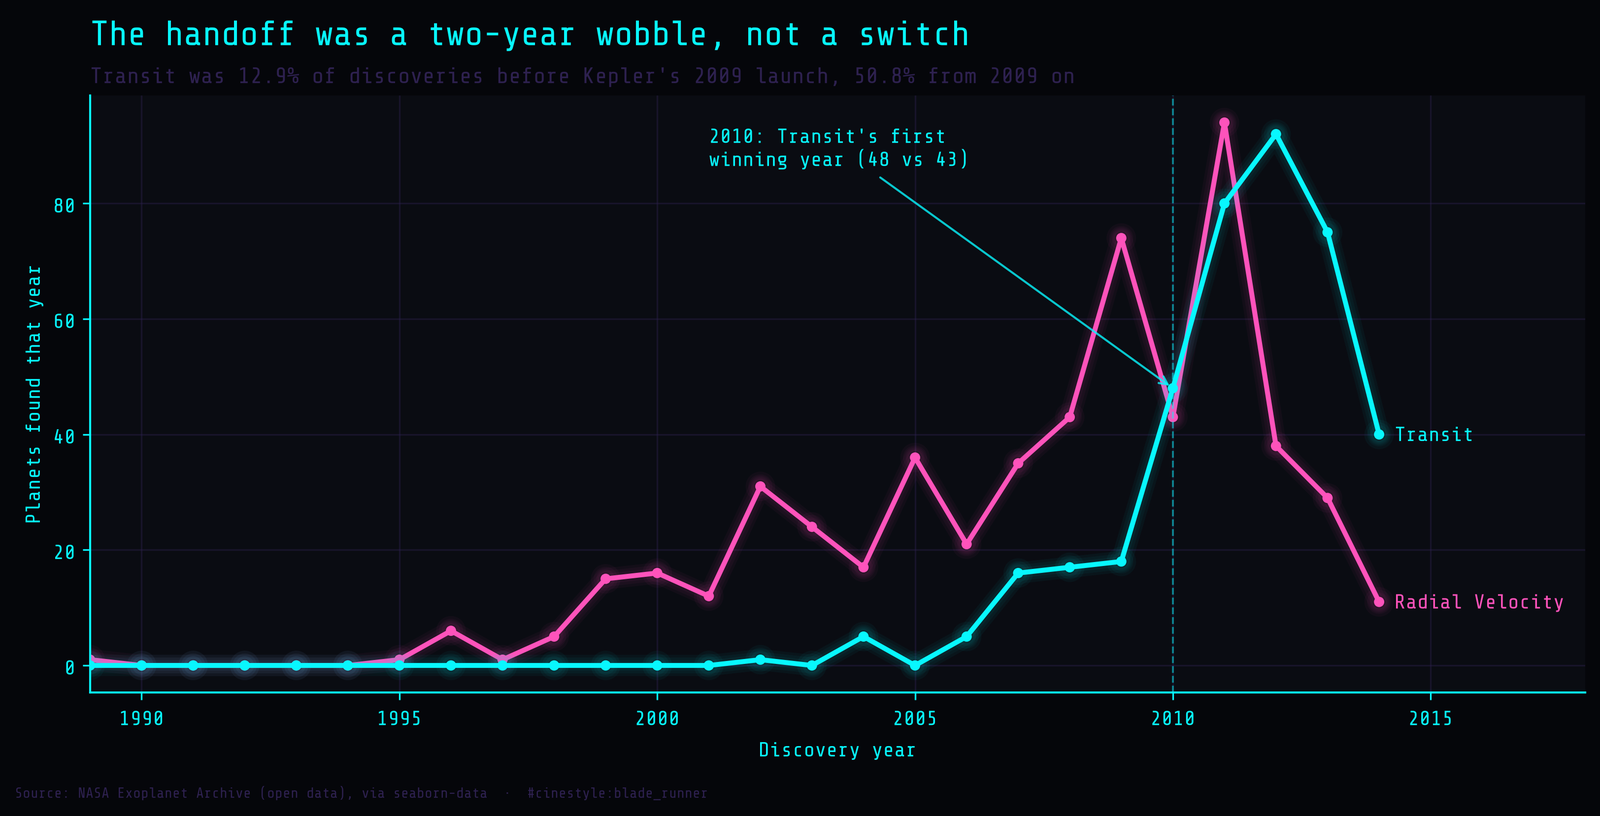
You can see the launch in the data. Before 2009, Transit was 12.9% of all discoveries. From 2009 onward it is 50.8%. The yearly lines first cross in 2010, when Transit edges out Radial Velocity 48 to 43. That crossover is not clean. Radial Velocity snaps back ahead in 2011, 94 to 80, and only from 2012 on does Transit hold the lead for good. So 2010 is the first time Transit wins a year, not the year it took over. The takeover is a two-year wobble, not a switch.
That is a tooling timeline. What I did not expect was how much each tool changes the kind of planet that comes home.
Each method finds its own kind of planet
I split the four best-sampled methods, each with at least 20 detections, and took medians, which survive outliers better than means in a dataset this skewed.
The orbital periods alone tell the story. The median Transit planet orbits its star in 5.7 days. The median Radial Velocity planet takes 360 days. That is almost two orders of magnitude. Picture the geometry: Transit can only see a planet if its orbit happens to pass between us and the star, and that alignment gets far more likely for planets hugging close in. So Transit finds hot, fast planets. It is structurally blind to the slow ones. Radial Velocity, meanwhile, needs to watch a star through a full orbit, or most of one, to confirm a period, which biases it toward planets it can catch in a few years.
Distance splits them too. Radial Velocity’s median planet sits at 40 parsecs; Transit’s at 341. Kepler stared deep into one field and pulled in faint, far transits. The exotic methods live at the extremes. Imaging’s median orbital period is 27,500 days, roughly 75 years, because you can only resolve a planet as a separate dot of light if it is flung far from its star’s glare. Microlensing’s median distance is 3,840 parsecs, an order of magnitude past anything else, because it relies on a chance gravitational alignment with a background star and those happen toward the crowded galactic center.
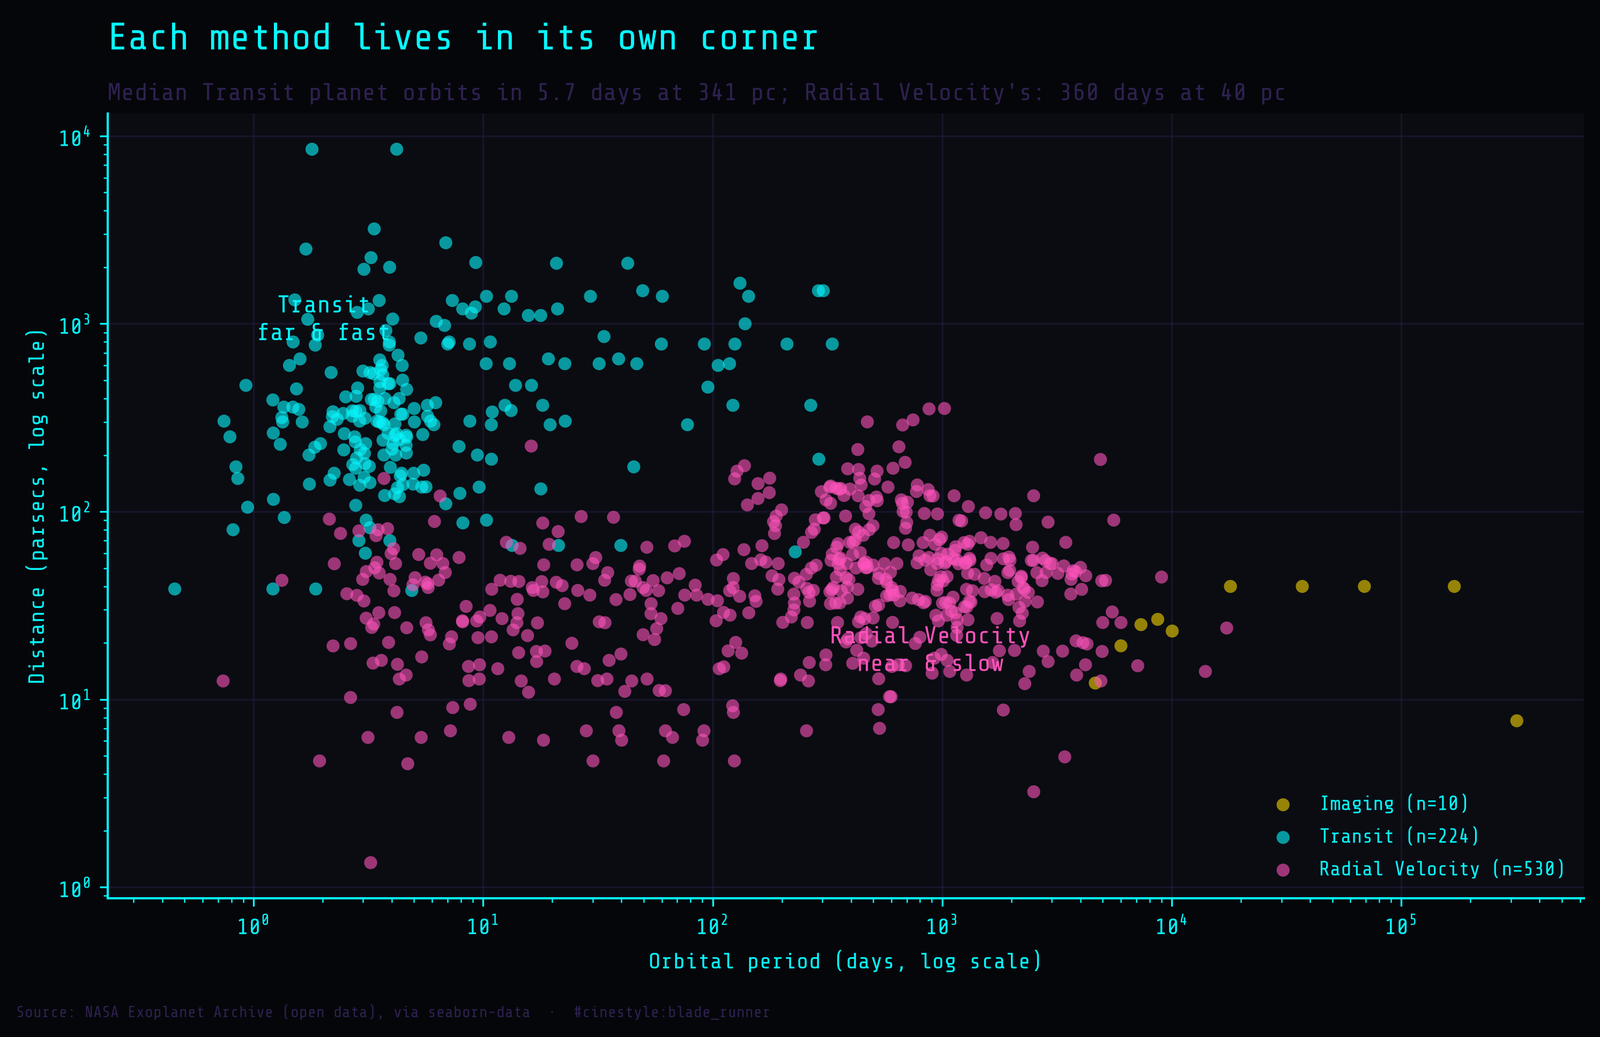
I plotted period against distance rather than period against mass, and that is a confession in itself: mass is missing for almost every Transit planet, so a period-mass scatter would have been a near-solid block of Radial Velocity with one lonely cyan dot. Period and distance both survive for 530 Radial Velocity planets, 224 Transit ones, and only 10 Imaging ones, and they split the methods cleanly. Transit clusters up and to the left: short periods, far away. Radial Velocity sits low and to the right: longer periods, nearby. There is barely any overlap. If you handed someone this plot with the labels stripped off, they could still draw the method boundaries by eye. Microlensing does not appear at all, because none of its planets has both a period and a distance. The methods that do appear are separate populations, not samples of one, because they come from separate instruments.
What is missing is the loudest evidence
This is the result I did not expect. Mass is missing for 522 of the 1,035 planets. That is 50.4% of the catalog with no mass at all. My first instinct was to treat it as a data-quality annoyance. It is the bias itself, written in negative space.
Break the missing masses down by method and the pattern is stark. Radial Velocity is missing mass for 7.8% of its planets. Transit is missing it for 99.7%, 396 of 397. Imaging and Microlensing: 100%, every single one.
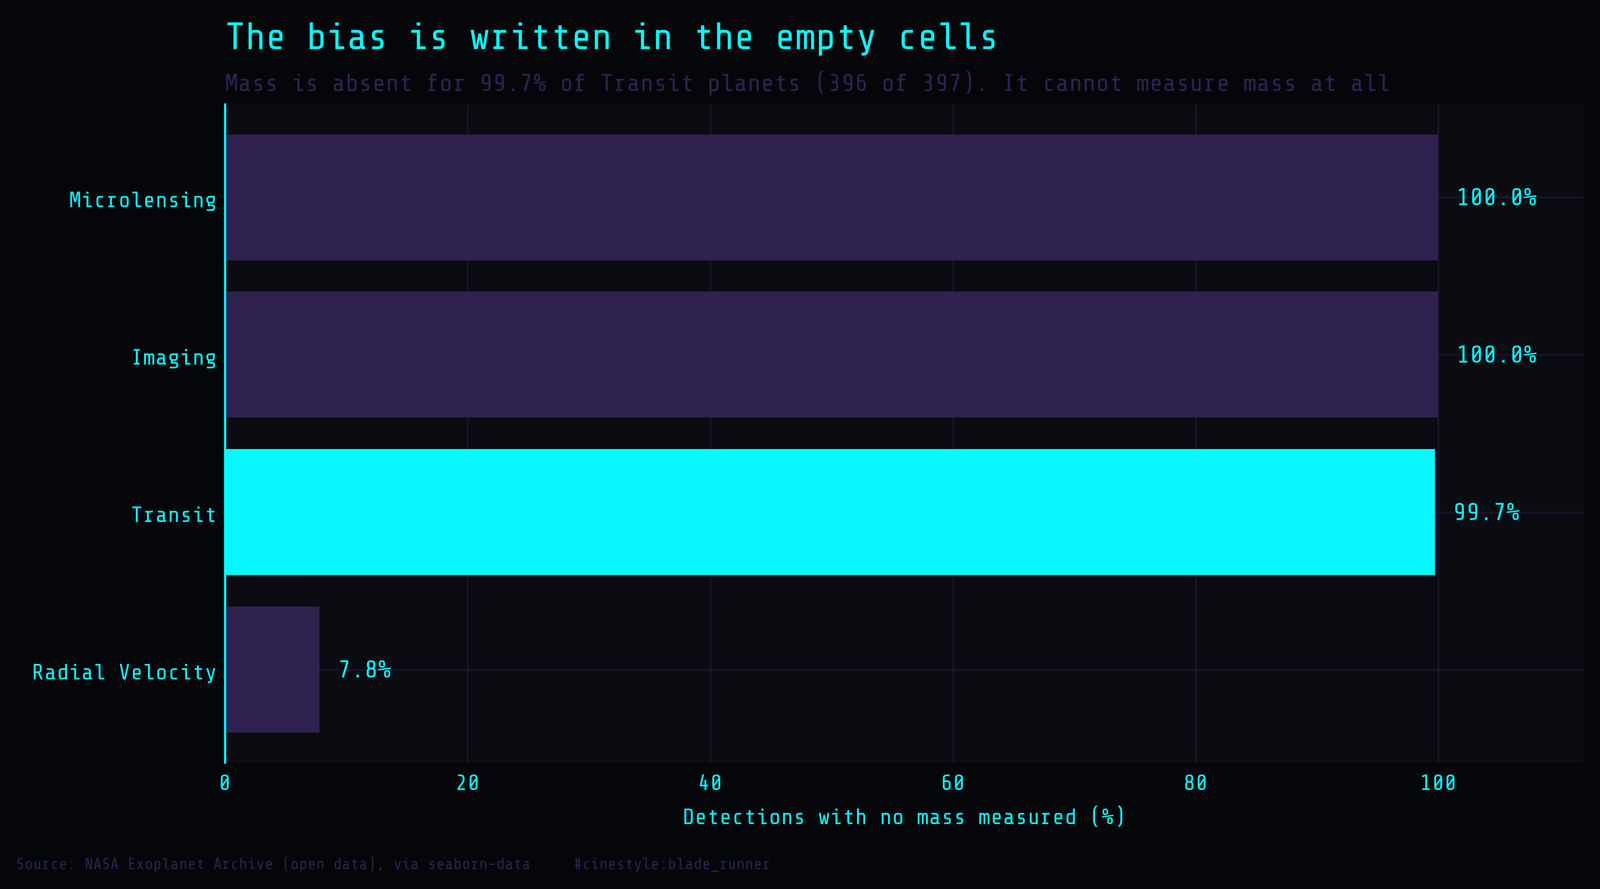
The gap comes from physics, not sloppiness. Radial Velocity measures mass directly, or at least a minimum mass (m sin i, since the tilt of the orbit is unknown). That is what the wobble is. Transit measures how much light a planet blocks, which tells you the planet’s radius, not its mass. To get a transiting planet’s mass you need a second method, usually a Radial Velocity follow-up, and for most of Kepler’s faraway targets nobody did that, or could. So the catalog’s biggest column of holes maps almost perfectly onto its second-biggest method. The absence of a number is itself a fingerprint of how the planet was found.
It also quietly wrecks any naive question about the typical exoplanet mass. Half the answers come from one method’s leftovers. The median Transit mass in the data, 1.47 Jupiter masses, rests on a single planet out of 397. I reported it because the script computed it, but I would not lean on it. Orbital period and distance, which are missing for only 4.2% and 21.9% of the catalog, are where the honest comparisons live.
So what is this dataset a picture of?
A galaxy where the typical Transit planet orbits in under six days and sits 341 parsecs away is not the galaxy we live in; it is the galaxy Kepler could see. Swap the instrument and the typical planet changes shape. Radial Velocity’s typical planet is a year-long orbit 40 parsecs out. Imaging’s is a 75-year orbit. Microlensing’s sits 3,840 parsecs away.
Every catalog is a confession about its instruments. This one happens to make the confession easy to read, because somebody recorded the method next to every planet and left the mass column honestly empty when nobody could measure it.