// article
The MPG Paradox
A bigger engine made these cars more efficient, and other lies of regression
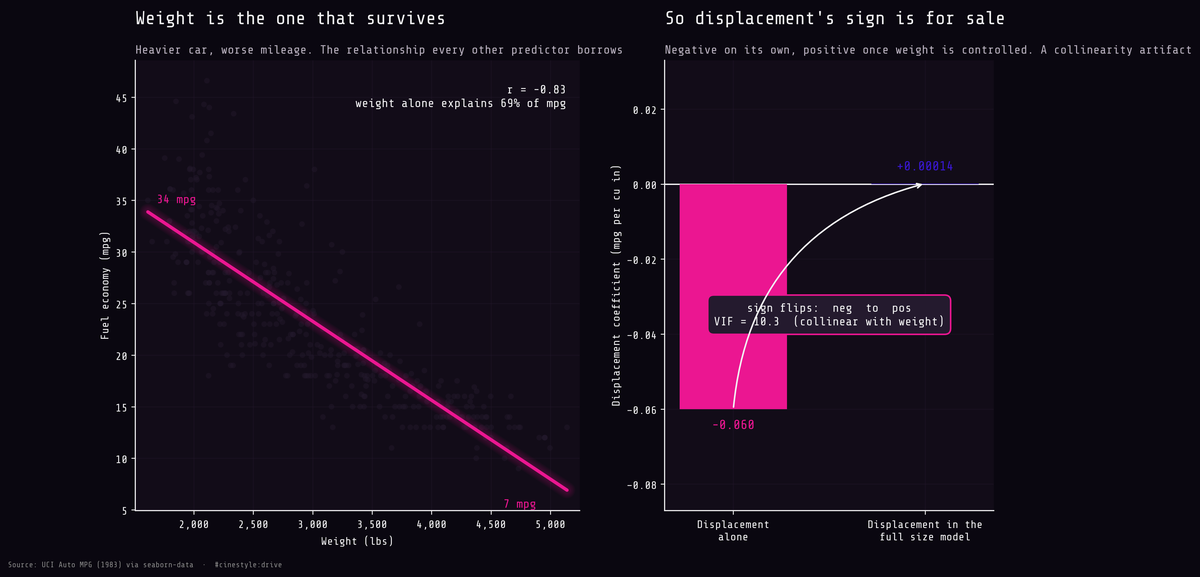
A regression coefficient is only as honest as the variables sitting next to it. Put two predictors that move together in the same model and the coefficients stop measuring effects and start splitting credit. The Auto MPG dataset shows this in one number you can watch change sign.
The flagship chart has two panels. On the left, weight against mpg: a clean negative line, r = -0.83, no tricks. On the right, displacement’s regression coefficient. It is clearly negative when it stands alone, then a positive sliver once weight, horsepower, and cylinders are in the model. Same data, opposite sign, and the only thing that changed is that displacement now shares the room with a variable it correlates with at 0.93 (VIF 10.3).
Fit mpg against engine displacement alone and the slope is -0.060 mpg per cubic inch, a correlation of -0.81: bigger engine, worse mileage, exactly what anyone would guess. Now put displacement in a model next to weight, horsepower, and cylinder count. The coefficient is +0.00014, positive. After you account for how heavy the car is and how many cylinders it has, a few extra cubic inches of displacement come with a hair more mpg, not less.
The positive sign is a collinearity artifact, not physics, and this dataset shows the effect cleanly.
The data
UCI Auto MPG, 1983 vintage, pulled through seaborn-data. 398 rows, one per car, model years 1970 through 1982. Each row has mpg, weight, displacement, horsepower, cylinders, acceleration, model year, and origin (USA, Europe, Japan). Six rows have a missing horsepower value. I did not impute them. I dropped them, which leaves 392 cars. That is small enough that I will not oversell any single coefficient, big enough to see the structure.
The structure, at first, looks easy. Everything that should drag mpg down does:
- weight vs mpg: -0.832
- displacement vs mpg: -0.805
- horsepower vs mpg: -0.778
- cylinders vs mpg: -0.778
Four predictors, four strong negative correlations, all clustered between -0.78 and -0.83. Stop here and you would write a confident paragraph about how heavy, powerful cars guzzle gas, and you would be right, and you would have learned almost nothing. Those four correlations are one finding, because the predictors move together.
They are all the same variable in a trenchcoat
Look at the predictors against each other instead of against mpg:
- weight to displacement: 0.933
- displacement to horsepower: 0.897
- weight to horsepower: 0.865
A heavy car has a big engine has high horsepower. In this dataset they are nearly interchangeable. The variance inflation factor measures how much each predictor is itself predicted by the others: 10.3 for displacement, 8.0 for weight, 5.3 for horsepower. Anything north of 5 is where people start getting nervous; displacement is past 10. The regression cannot cleanly tell whose effect is whose, so it splits the credit more or less arbitrarily.
Watch a single coefficient as I feed the model more correlated friends. Horsepower’s slope, fit alone, is -0.158 mpg per horsepower. Add weight and it collapses to -0.047: two-thirds of horsepower’s apparent effect was really weight standing in for it. Add displacement and cylinders and horsepower settles around -0.043, while displacement, the variable with the scariest solo correlation, lands at +0.00014. Effectively zero, wrong sign. The R-squared barely moves across all of this: 0.606 with horsepower alone, 0.708 with all four. Four predictors buy you ten extra points of fit over one, because each predictor you add is mostly already in the model.
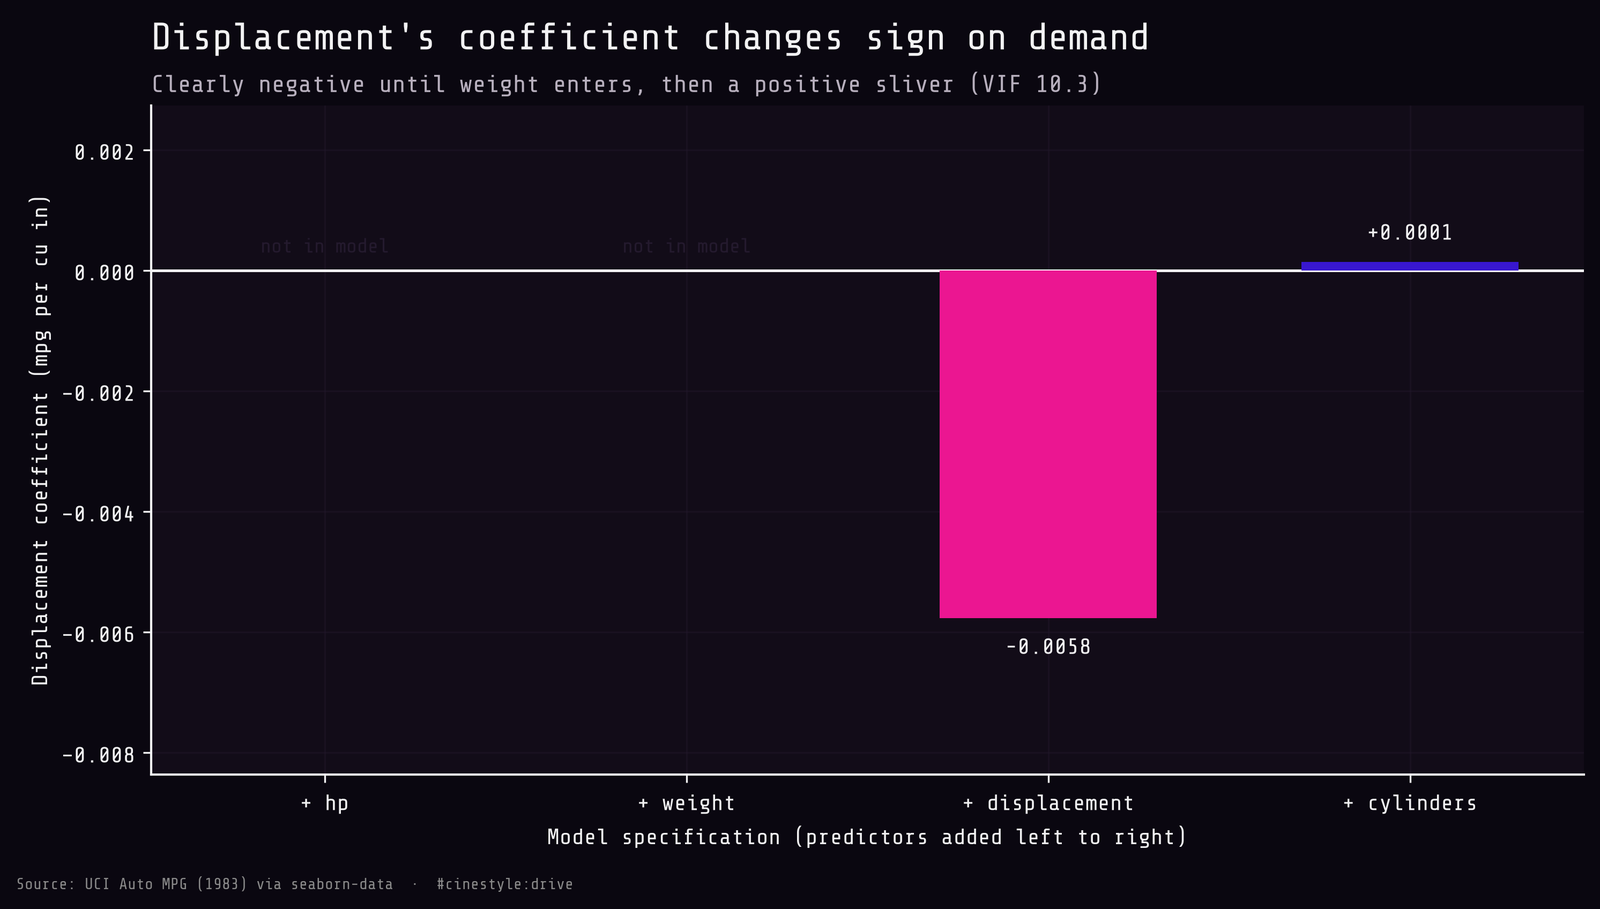
So when someone hands you a coefficient off a model stuffed with correlated features, the sign is negotiable and the magnitude is fiction. Weight keeps its sign in every model, from -0.0053 to -0.0058 mpg per pound across the size models and -0.0076 on its own. If I had to bet on one causal story, I would bet on weight. The rest ride along.
The year effect is real, and half of it is a diet
Model year tells a cleaner story. Regress mpg on year and the slope is +1.23 mpg per model year (p is about 1e-36, so the trend itself is not in doubt). Across the 1970-to-1982 span that is something like fifteen extra miles per gallon, which tracks with the oil shocks and the first fuel-economy standards biting.
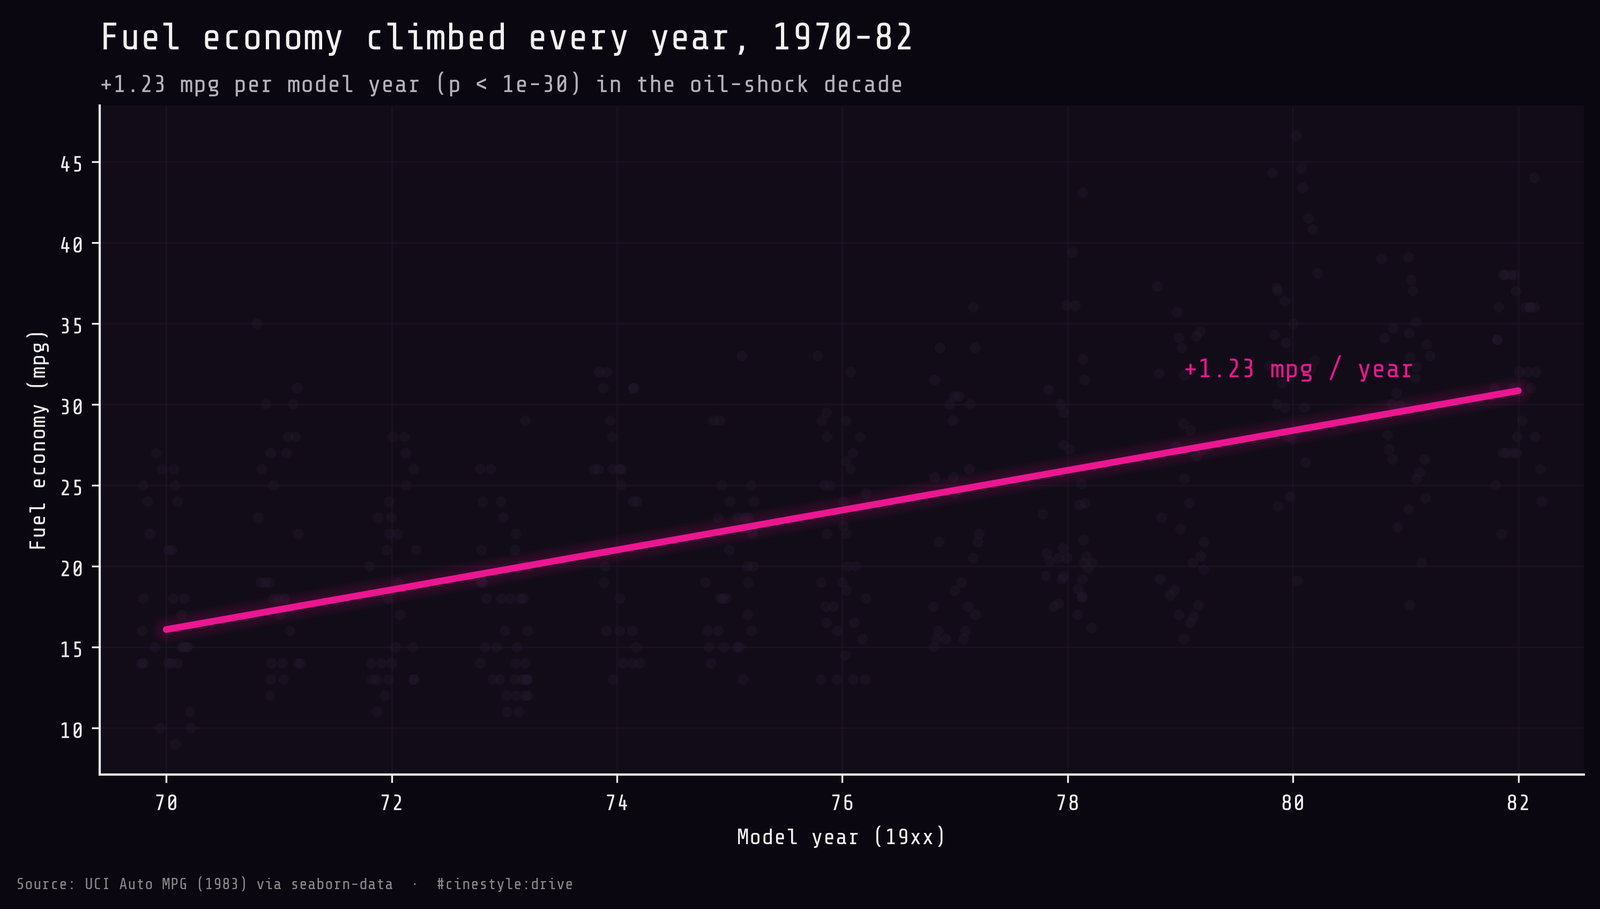
But how did they pull it off? Partly by making cars lighter. Control for weight and the year coefficient drops to +0.76 mpg per year. So about 38% of the year-over-year improvement is just cars getting smaller and lighter over the decade. The remaining +0.76 is everything else that changed, such as engines, fuel delivery, and aerodynamics, which this data cannot separate. The headline +1.23 combines both effects.
Origin: lighter, but not only lighter
The raw origin gap is stark. Median mpg: USA 18.5, Europe 26.0, Japan 31.6. A Kruskal-Wallis test puts that difference past any reasonable doubt (H is about 132, p is about 2e-29). But American cars in this set averaged 3373 lbs, Japanese ones 2221 lbs. Of course the heavier cars drink more. Is “origin” just weight wearing a flag?
Mostly. Put weight and origin dummies in one model (Europe as the baseline) and the gaps shrink hard. A Japanese car is worth +1.36 mpg over a comparable-weight European one; an American car, -0.97 mpg. So the 13-mpg chasm between US and Japan collapses to about 2.3 mpg once you compare cars of the same weight. The gap shrinks without vanishing: Japan still edges out the field at equal weight and the US still trails. But most of the origin story was always a weight story dressed up as a national one.
Where this stops applying
These are cars from 1970 to 1982. Carbureted, mostly, pre-everything. 392 rows after I dropped the six missing horsepower values. None of this generalizes to a 2026 hybrid, and the coefficients are descriptive, not a law of nature, because I never randomized anything. What does travel is the lesson about the method: when your predictors correlate at 0.93, a regression coefficient is an opinion, not a measurement. The fix is to check collinearity before trusting a sign, not to fit a fancier model.