// article
Detroit Versus Japan
Detroit caught up to Japan, but only after you weigh the cars
In 1970, the average Japanese car in this dataset got 25.5 mpg and the average American car got 15.27. By 1982 the American average was 29.45 and the Japanese average was 34.89, still a gap, but down to about 5.4. Detroit closed roughly half the distance to Japan over twelve model years. That is the headline, and underneath it is a story about weight.
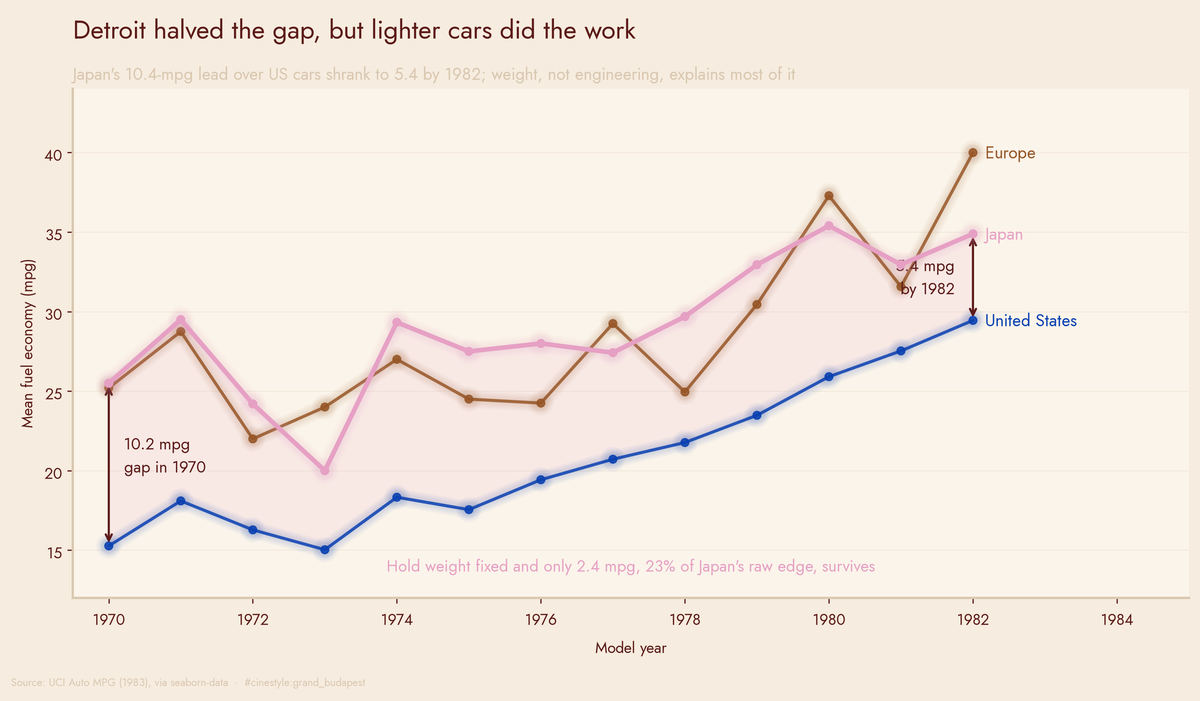
That shaded wedge closes by about half across twelve years, and the footnote on it is the twist. Hold weight constant and only 23% of Japan’s lead survives, 2.36 mpg out of 10.37. Most of what looked like a national gap was a weight gap.
The data
UCI Auto MPG, the 1983 release, pulled through seaborn-data. 398 rows, one car each, model years 1970 through 1982. The columns that matter here: mpg, weight in pounds, model year, and origin, coded usa, europe, or japan. There are 6 missing horsepower values in the set. I checked, and since this analysis never touches horsepower, I kept all 398 rows. mpg, weight, and origin are complete.
The sample is lopsided by origin: 249 American cars, 79 Japanese, 70 European. That imbalance matters for the year-by-year slices: 79 Japanese and 70 European cars spread across thirteen model years leave each single-year mean resting on few cars. Treat those means as noisy.
The raw gap is huge, and obvious, and a little misleading
Average mpg over the whole span: USA 20.08, Europe 27.89, Japan 30.45. A Japanese car beats an American one by 10.37 mpg on average, and a European one beats it by 7.81. If that were the end of it you would conclude American engineers spent the 1970s asleep.
But look at what these cars weigh. Mean weight: USA 3361.9 lbs, Europe 2423.3, Japan 2221.2. The average American car in this set outweighs the average Japanese one by over half a ton. A car is a thing you have to shove down the road, and a heavier thing takes more fuel to shove. So the question is not whether American cars got worse mileage. They did. The question is whether origin explains anything once you account for the fact that American cars were built like tanks. Until you weigh the cars, the flag on the trunk is doing work that the curb weight should get credit for.
Everyone improved, including Detroit
First, the trend. I fit mpg against model year separately for each origin. All three slopes are positive and steep: USA +1.12 mpg per year, Europe +1.03, Japan +0.95. Twelve years of that, and even the slowest-improving origin gains better than eleven mpg. The US slope is the steepest of the three.
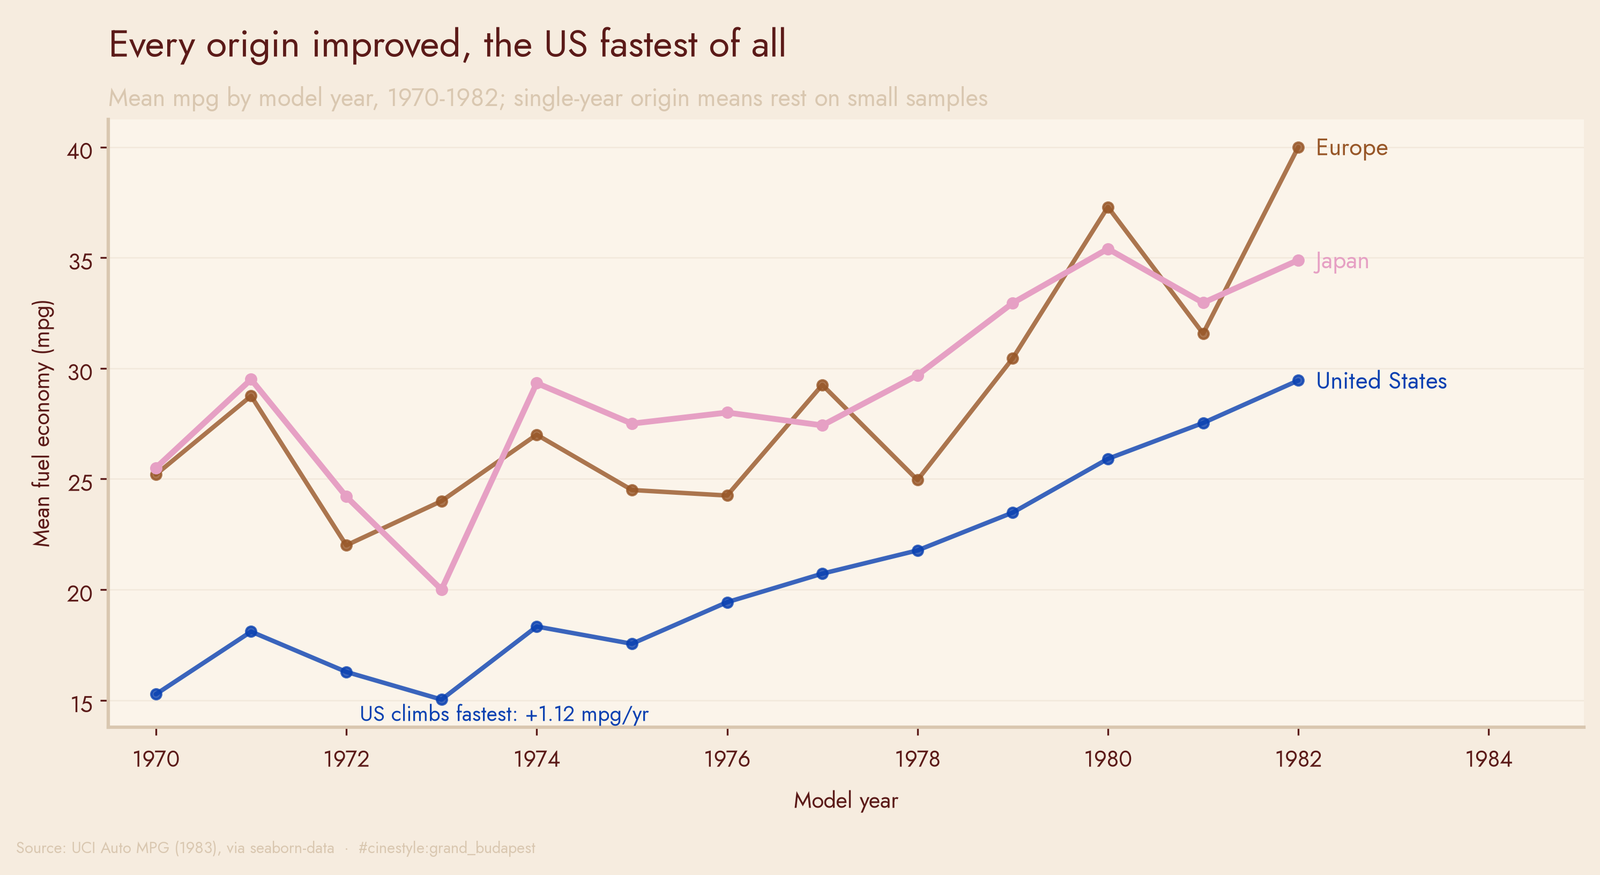
The chart is noisier than the slopes suggest, and that is the sample size showing through. The Japanese and European lines jump around year to year because each model year carries only a few of their cars. Do not read the single-year wiggles as signal. The 1982 European number, 40.0, is the kind of figure I would want more cars behind before I leaned on it. The overall climb is unmistakable across all three.
So did the US close the gap? Against Japan, yes: the 1970 gap of about 10.2 mpg shrinks to about 5.4 by 1982, a narrowing of roughly 4.8 mpg. Against Europe, no, and this is the dead end I did not expect. The US-Europe gap in 1970 was 9.93 mpg and in 1982 it was 10.55, slightly wider. Europe did not run away, but Detroit did not catch it either, even while it was reeling Japan in. Convergence is not one clean story. It depends on who you measure against.
Now weigh the cars
If American cars are heavy and heavy cars guzzle, maybe origin is just a flag stapled onto weight. I tested it directly: regress mpg on weight plus origin dummies, with the US as the baseline category. The origin coefficients now read as extra mpg versus an American car of the same weight.
Picture two cars of identical curb weight, one stamped in Detroit and one in Toyota City, set side by side. The coefficient is the mpg difference left over after weight is held still. The weight term comes out to about -0.007 mpg per pound. Every extra hundred pounds costs roughly 0.7 mpg, which is sensible. And the origin gaps collapse. A Japanese car is worth +2.36 mpg over an equally heavy American one (p ≈ 0.0004). That is down from the raw 10.37. Only about 23% of the raw Japan-US advantage survives once you compare cars of equal weight. The other 77% was weight all along. Japan built lighter cars, and lighter cars sip fuel.
Europe is even starker. Its raw 7.81 mpg edge shrinks to +1.22 mpg at equal weight, about 16% of the original, and the coefficient is only marginally significant (p ≈ 0.06). Strip out weight and the European advantage nearly evaporates. The model with weight and origin together explains about 70% of the variance in mpg, and weight alone already gets you most of that (R² 0.69 versus 0.70). Origin adds about one point of R² once weight is in the model.
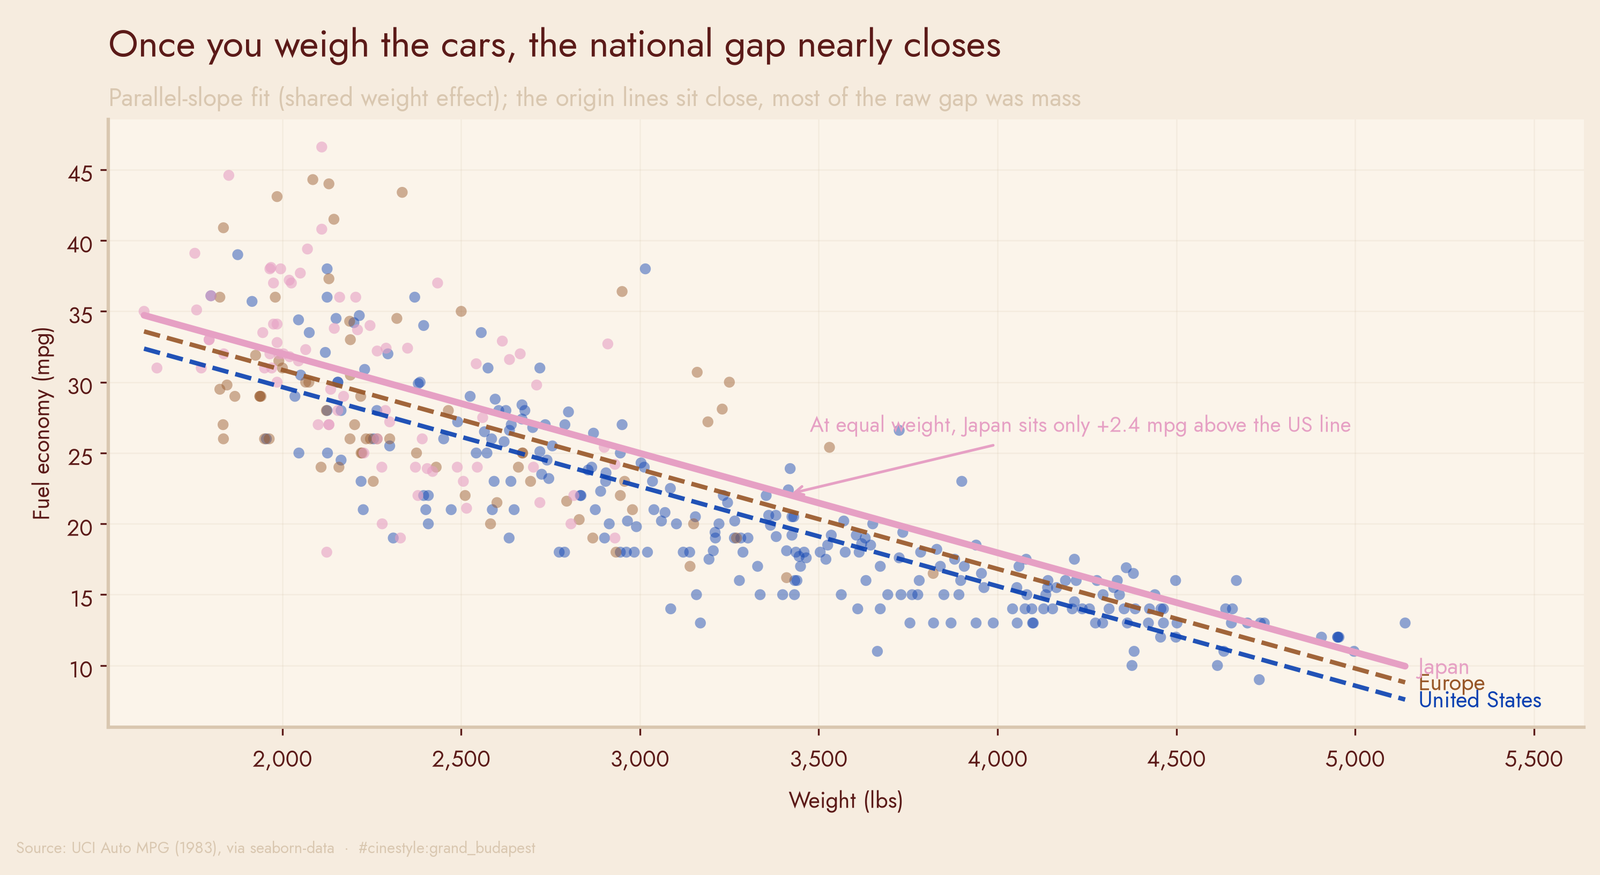
The scatter makes the point better than the coefficients. The three point-clouds overlap through the middle of the weight range. The dashed fit lines, one per origin and all sharing a slope, stack close together. Japan’s sits a little above, the US a little below, but the spacing is small compared to the spread of the raw data. Most of what looks like a national gap is the same downward weight trend, with American cars parked at the heavy end of it.
What I would stand behind
The US closed about half of its gap with Japan over these twelve years, 4.79 of 10.23 mpg. The surviving 2.36 mpg origin effect is genuine, statistically and otherwise. But the raw 10-mpg gulf was always mostly mass. Japan’s edge was that it sold light cars to a market that wanted light cars. The engineering edge, once you hold weight fixed, is real but modest.
The usual caveats, and I will not soften them: 398 cars, model years 1970 to 1982, badly imbalanced across origins, with single-year origin means resting on tiny counts. Nothing here is randomized. Heavier cars differ from lighter ones in a hundred ways I am not measuring, so controlling for weight buys me a cleaner comparison, not a causal one. And these are carbureted cars from before catalytic converters were universal. The lesson that travels is not about 1982. It is that a ten-point gap can be three-quarters confound, and the only way to find out is to weigh the thing you are comparing.