// article
Seattle's Weather
Seattle rains on 43.9% of days. It is sunny on 43.8%.
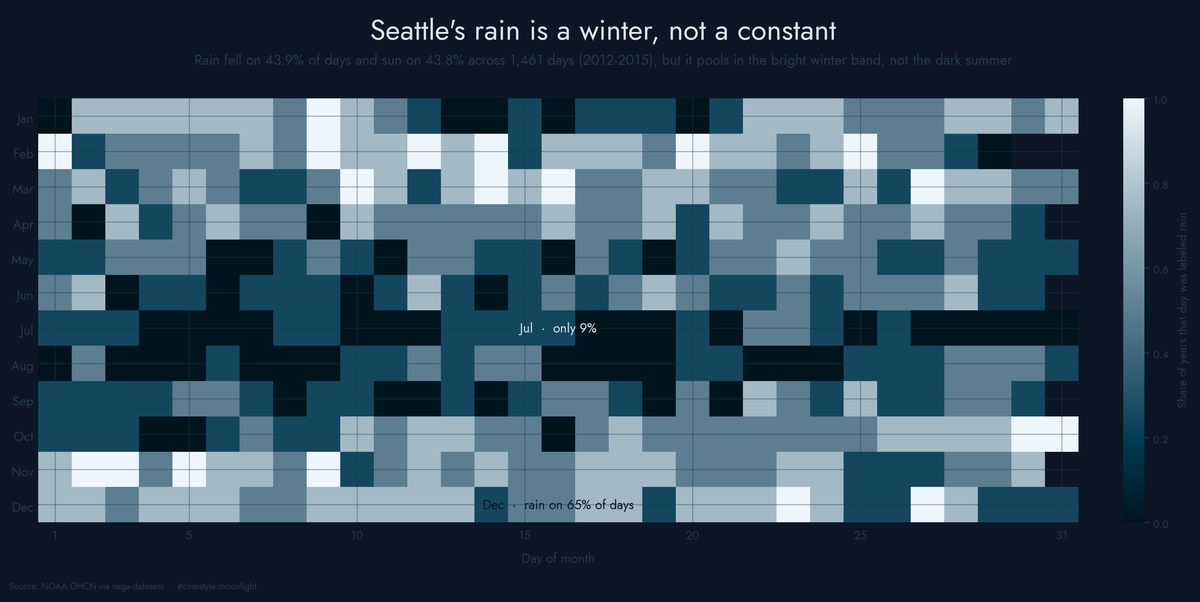
Seattle’s umbrella reputation is real on the year and almost meaningless on the day. Pull four years of daily records and count the labels. Rain shows up on 43.9% of the 1,461 days from 2012 through 2015. Sun shows up on 43.8%. Those are 641 days and 640 days, one day apart out of fifteen hundred. The city built its weather brand on a coin flip.
I built the calendar above before writing a word, because it settled the question for me. The rain is not spread across the year. It is pooled into a bright winter band with a dark dry hole punched through summer.
The data is the seattle_weather set from vega-datasets, sourced from NOAA GHCN: a date, daily precipitation in mm, max and min temperature, wind speed, and one categorical weather label per day. Five labels total. After rain and sun, everything else is a long tail: fog on 6.9% of days, drizzle on 3.6%, snow on 1.8%. No missing values anywhere, which almost never happens and made me re-check the loader.
So the reputation is not built on how often it rains. Look past the label and ask whether any rain fell at all, precipitation greater than zero. That happens on 42.6% of days. The other 57.4% are bone dry. The mean daily precipitation is about 3.0 mm, but the median is exactly 0.0. Picture the gauge: most days it catches nothing, and a minority of soakers drag the average up past a number no typical day ever reaches. That is the gray-drizzle stereotype. Not constant rain, but a lot of days that never quite commit to being sunny.
The seasons do all the work
The annual coin flip hides a hard seasonal swing. Split the rain label by meteorological season and the winter months (Dec/Jan/Feb) are labeled rain 58.7% of the time. Summer months (Jun/Jul/Aug) drop to 22.3%. That is a 2.64x difference between the wettest and driest stretches of the year, from the same city.
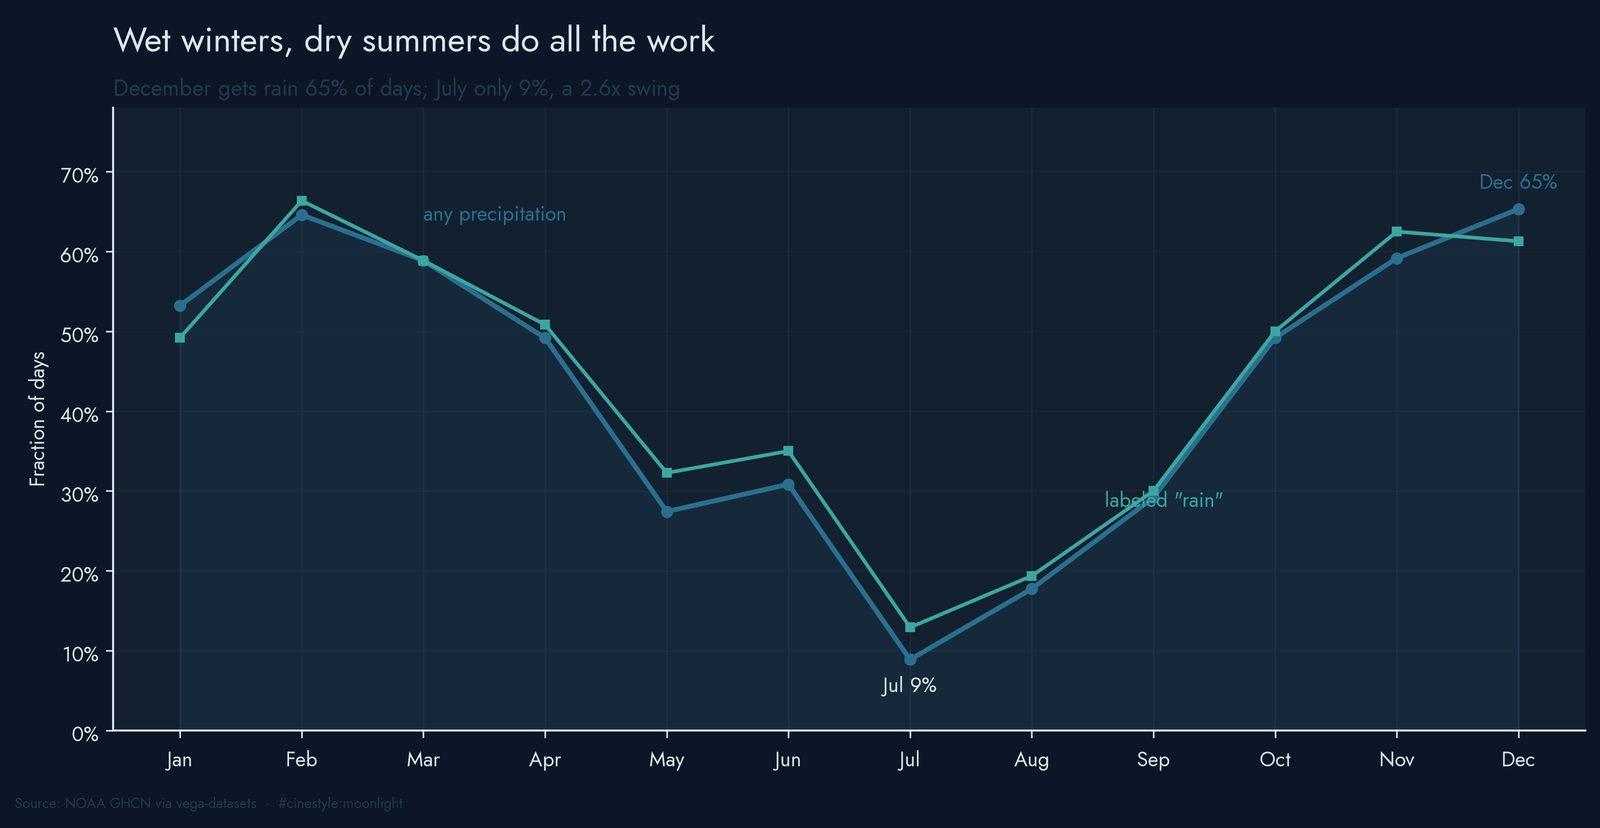
The monthly view is steeper still. December is the wettest month: some precipitation fell on 65.3% of its days. July is the floor at 8.9%. The two curves, any precipitation and the rain label, track each other closely. The labeled-rain line sits at or above the any-precipitation line in ten of twelve months, which means some days carry a rain label with zero precipitation in the gauge. Visit in July and the reputation looks like a hoax; visit in December and it looks earned.
Can you predict the label from the numbers?
Here is the question I wanted to answer. Hand a model the precipitation, both temperatures, and the wind for a day, and can it recover the label a human assigned? I split the 1,461 days into 1,022 for training and 439 for test, stratified by label and seeded at 42, then ran a random forest inside a pipeline so nothing leaks across the split.
Test accuracy came in at 81.3%. The majority-class baseline, which guesses the most common training label (here, sun), gets 43.7%, so the model nearly doubles it. That sounds like a win until you look at what it is doing.
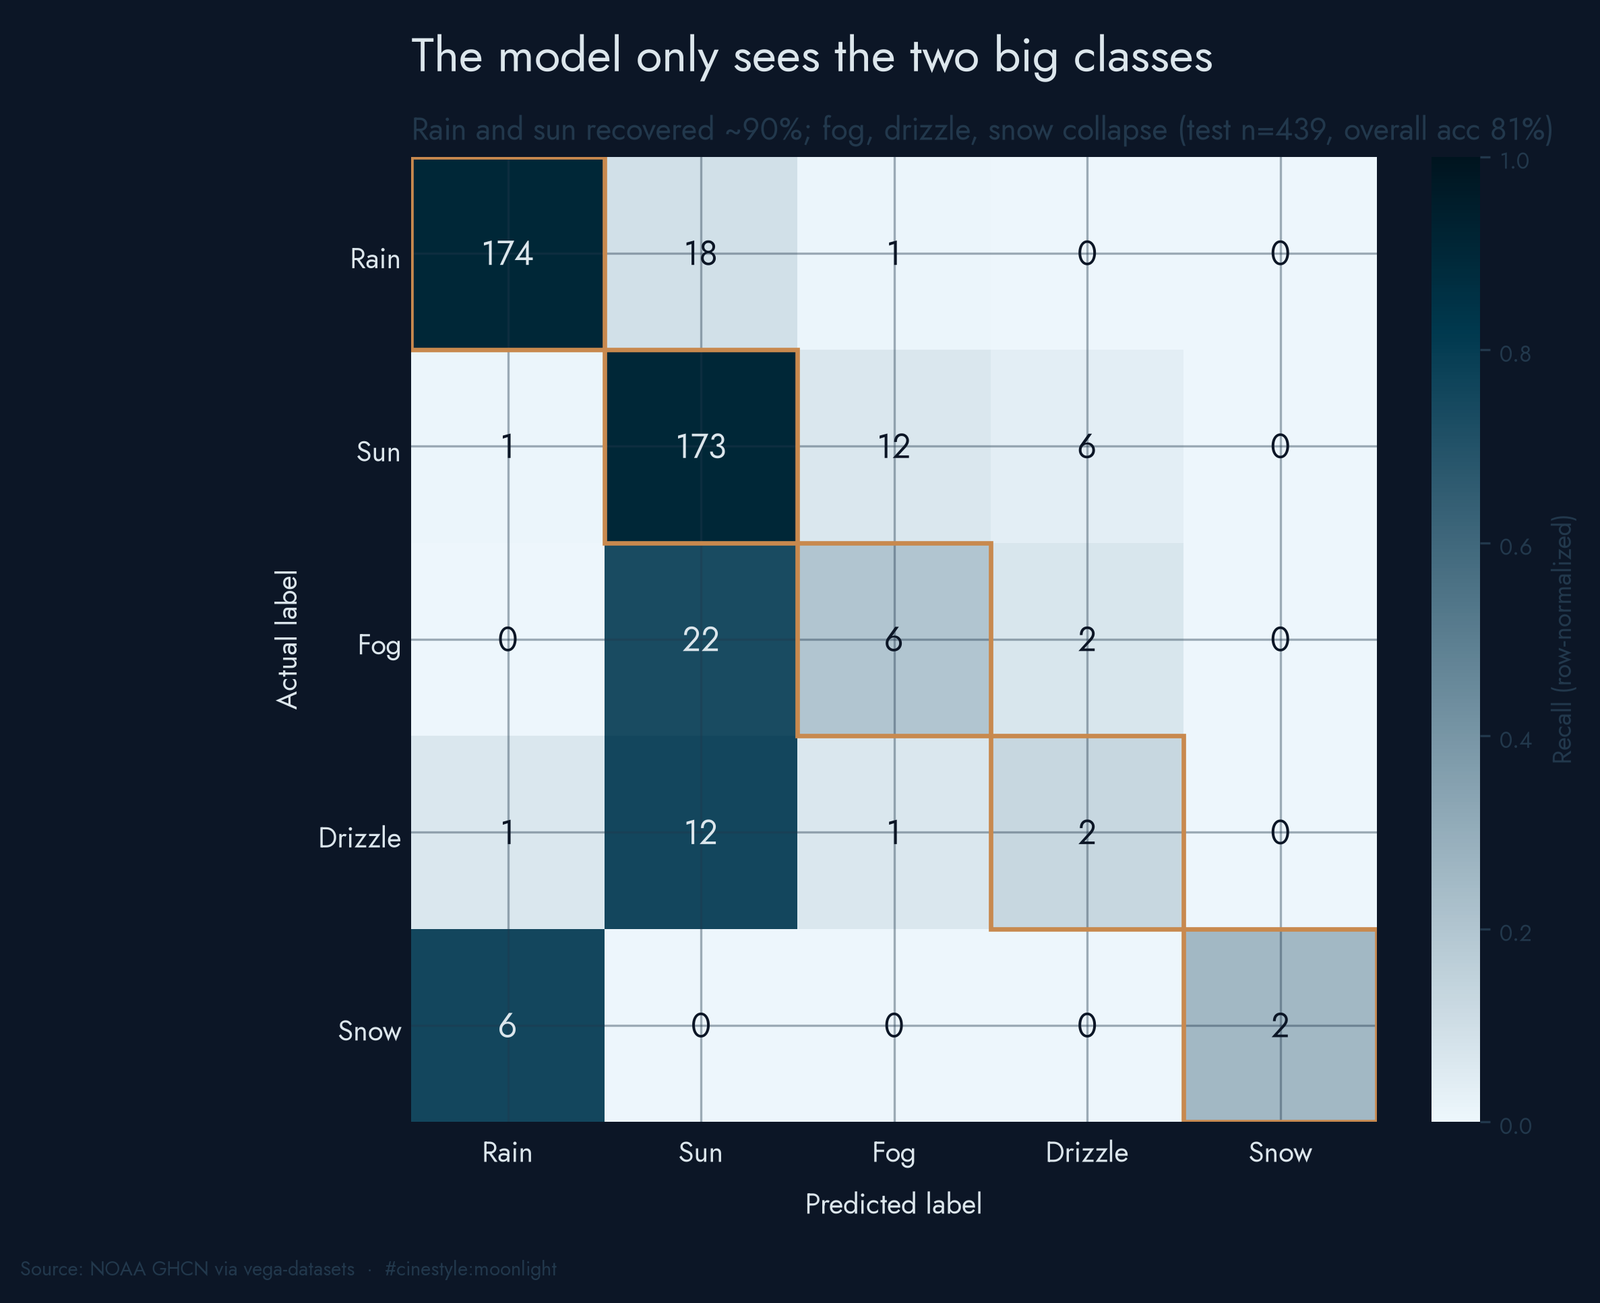
Per-class recall splits the model into two animals. Rain it nails: 90.2% of true rain days recovered. Sun, the same story, 90.1%. But fog, drizzle, and snow fall apart, with recall of 20%, 12.5%, and 25%. The whole 81% rests on the two big classes the model can already separate cleanly.
The confusions are the ones you would guess from the labels themselves. The single most-confused pair is fog called as sun: 22 of the 30 fog days in the test set, 73% of them, got labeled sunny. Drizzle has the same problem: 12 of its 16 days, 75%, also got read as sun. Both fog and drizzle are low-or-no-precipitation, mild-temperature days, and the model has no humidity or visibility column. On paper, a foggy morning and a sunny afternoon are the same row of numbers.
Is precipitation just cheating?
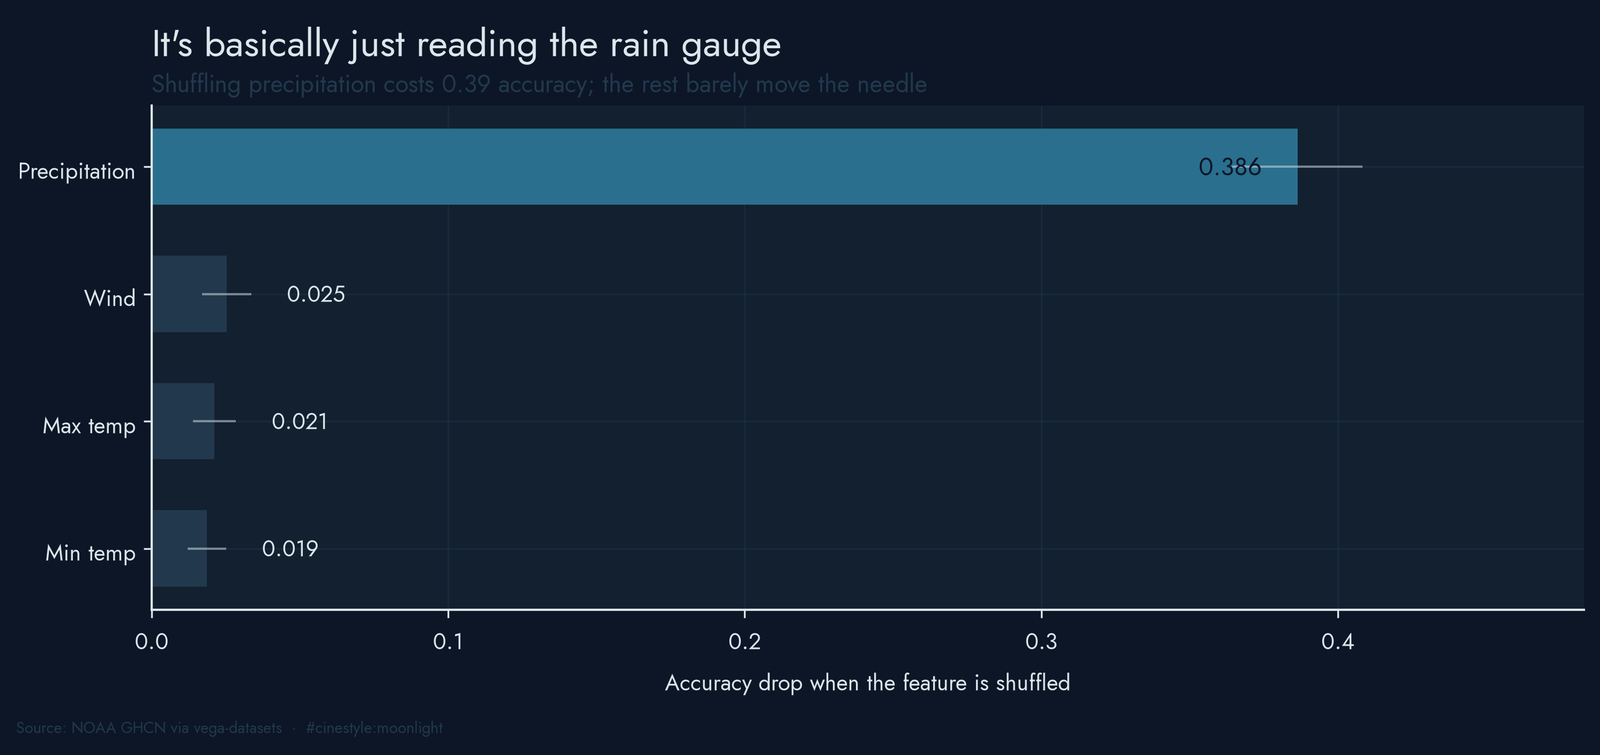
Permutation importance on the test set makes the strategy obvious. Shuffling precipitation drops accuracy by 0.386, by far the biggest hit. The other three features barely move the needle: max temp 0.021, wind 0.025, min temp 0.019. The forest is essentially a precipitation threshold with some temperature trim.
That feels like cheating, because a day labeled rain almost by definition had precipitation. So I retrained the same pipeline with precipitation removed entirely, just temperature and wind. Accuracy fell to 64.5%, a 16.9-point drop. Still well above the 43.7% baseline, which surprised me. Temperature alone carries real seasonal signal, since cold days skew wet and warm days skew sunny in this climate. But losing precipitation cost 16.9 of the model’s 37.6-point edge over the baseline, a bit under half. The classifier leans on the rain gauge first, and temperature carries the rest.
The limits are plain: this is four years from one station, and the labels are whatever the dataset’s authors assigned, not a meteorological ground truth I can audit. The fog-versus-sun confusion might be as much about where someone drew the line between fog and clear as about anything in the numbers. With 30 fog days and 16 drizzle days in the test set, those recall figures rest on small counts and should not be oversold.
What stuck with me is the opening number. Rain 43.9%, sun 43.8%. The reputation is not a lie, but it is not about frequency. It is about December, and about the long gray middle the labels can barely tell apart.