// article
Averaging the Wind
The wind blew north. The average said east-southeast.
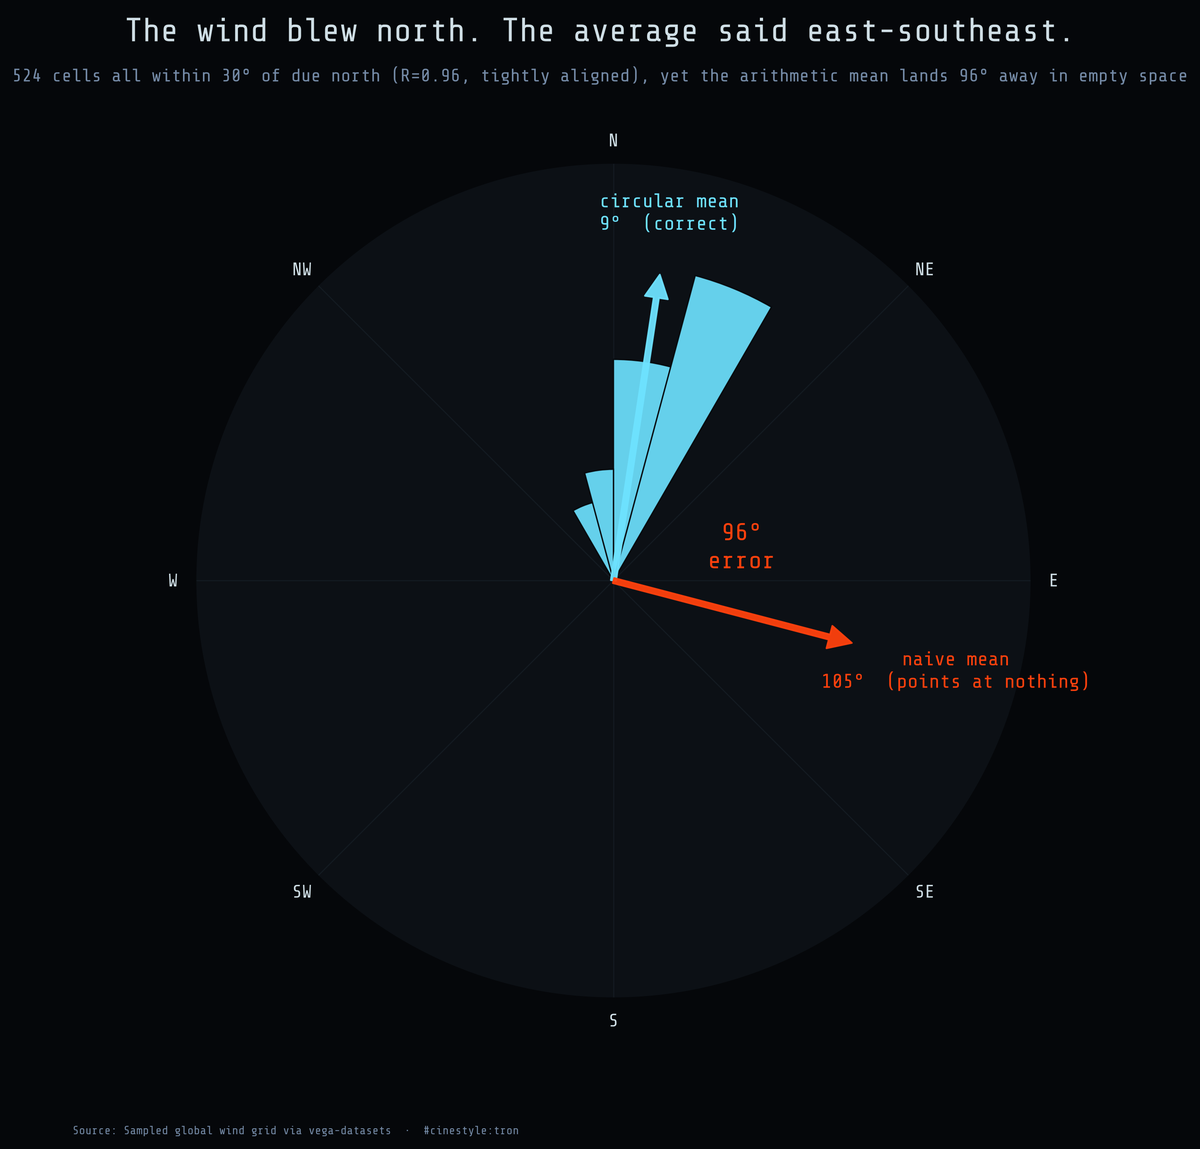
A compass direction is an angle, and the arithmetic mean does not know the number line wraps.
I pulled 524 grid cells where the wind was blowing roughly north, every one within 30 degrees of due north on either side of the compass seam at 0/360. Then I took the arithmetic mean of the direction column. It came back 104.67 degrees, east-southeast, a bearing no wind in this slice follows. The circular mean, the honest answer, is 8.61 degrees: due north, where the arrows actually point. That is a 96-degree gap between what the calculator returned and what the data does. The red arrow is df['dir'].mean(); the cyan arrow is the data.
The data
A sampled global wind grid from vega-datasets: 4,800 cells, each with a longitude, a latitude, a direction in whole degrees (dir, 0 to 360), a binned direction category (dirCat), and a speed. One caveat up front. This is a gridded snapshot of a wind field, not a stack of station observations. The cells sit on a regular lat/lon mesh, so neighboring points are spatially correlated and are not independent draws from anything. I am using it to demonstrate the arithmetic, not to make a climatological claim. Speeds run from a near-dead 0.01 up to 12.18, mean 4.54, and the dataset does not label units, so I leave them unitless. One more convention to fix before the math: I read dir as the bearing the wind blows toward, which is how the north slice below is defined. The math, not the meteorology, is the point.
Why the average lies
359 degrees and 1 degree are two degrees apart, not 358. The arithmetic mean has no idea the number line wraps, so it averages 359 and 1 to 180, which points the opposite way from both. Picture two winds, one blowing toward 350 and one toward 10, both leaning north. The naive formula stands them back to back and reports their midpoint as 180, due south, the one bearing neither wind is doing.
The fix is to stop treating directions as numbers and treat them as vectors. Turn each bearing into a unit vector, (cos θ, sin θ), average the x-components and the y-components separately, then read the resulting angle back with atan2. The wraparound takes care of itself, because 359 and 1 degrees land right next to each other on the circle. Three lines: mean the sines, mean the cosines, atan2(mean_sin, mean_cos).
On those 524 north-blowing cells the difference is the entire point. The histogram below shows them piled against both edges, a clump near 0 and another near 360, with nothing between. The naive mean in red falls into the empty middle at 105 degrees. The circular mean in cyan lands at 9 degrees, dead in the cluster.
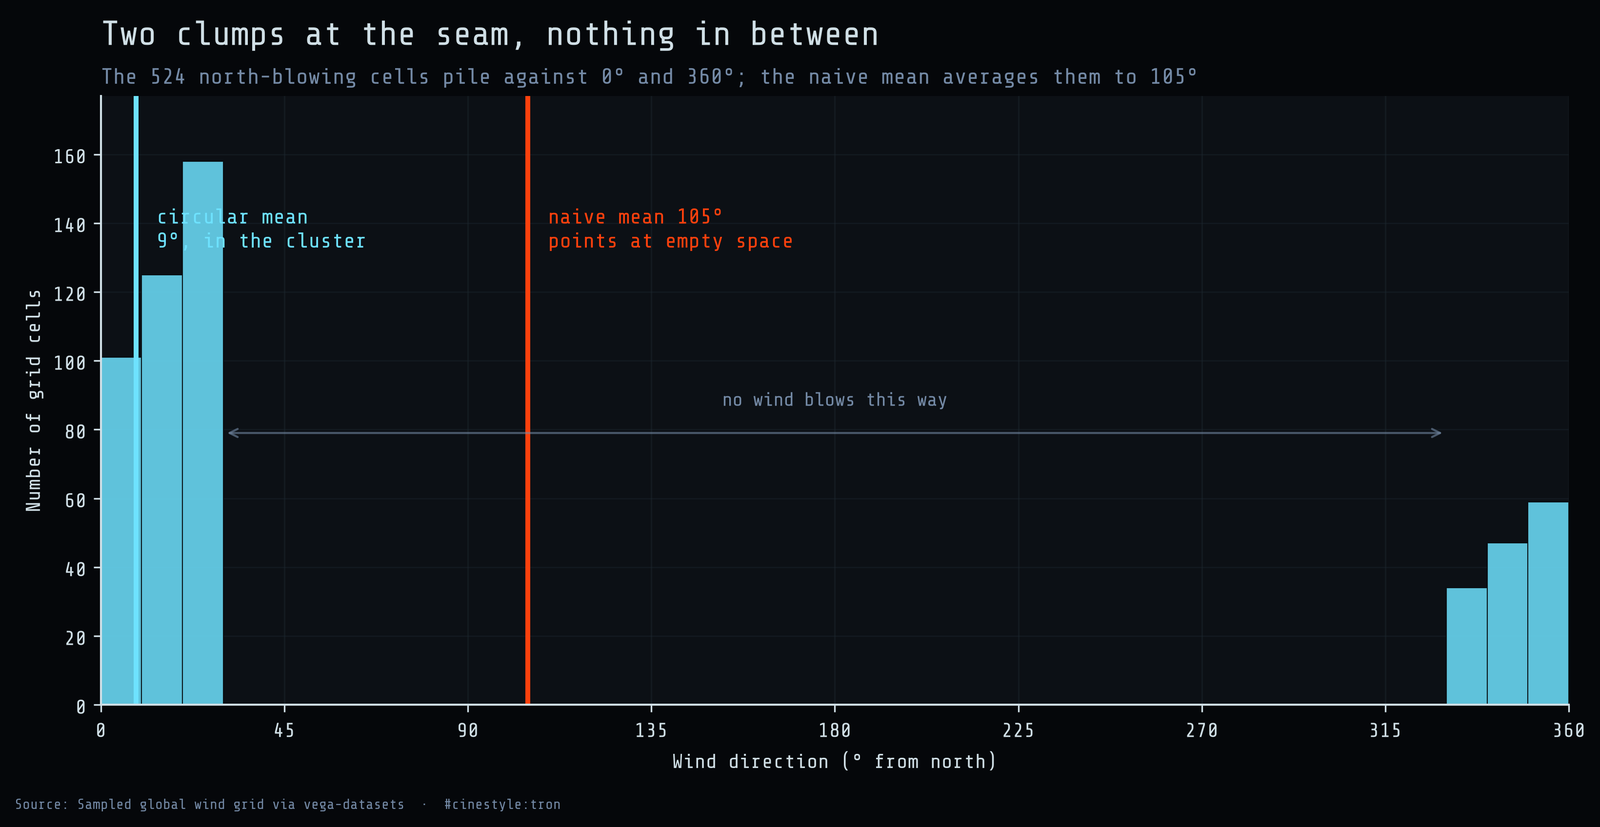
Laid on a straight axis the trap is plain: the two clumps sit at the far edges and the naive mean splits the difference, dropping into the empty span between them. The polar version sits at the top of this piece, where the cyan arrow shoots into the wedge the data occupies and the red arrow points off toward 105 where nothing blows. The mean of a wrapped quantity is not an approximation of the right answer; it is a different number.
Resultant length, or how to know if there even is an average
The vector trick hands you a second number for free. When you average those unit vectors, the length of the result, call it R, tells you how concentrated the directions are. Think of each bearing as a person pulling on a rope from the center of a circle. All pulling the same way, the knot flies to the rim and R goes to 1. Pulling evenly in all directions, the knot stays put and R goes to 0, and the mean direction is meaningless noise.
For those 524 north cells R is 0.9631, so they are tightly aligned and the mean direction means something. Run the same calculation over all 4,800 cells in the grid and R collapses to 0.133. That is a field with no prevailing direction. The circular mean of the whole grid is 129.68 degrees, but with R that low I would not trust that arrow to point anywhere in particular. It is the average of winds going every which way across the globe, and they mostly cancel. The naive mean of the full grid, for the record, is 154.87, off from the circular value by 25 degrees: still wrong, just less spectacularly than the north slice.
So R does double duty. It is the dial that tells you whether the mean direction you just computed is worth reporting. Report the mean direction when R is near 1, and drop it when R is near 0.
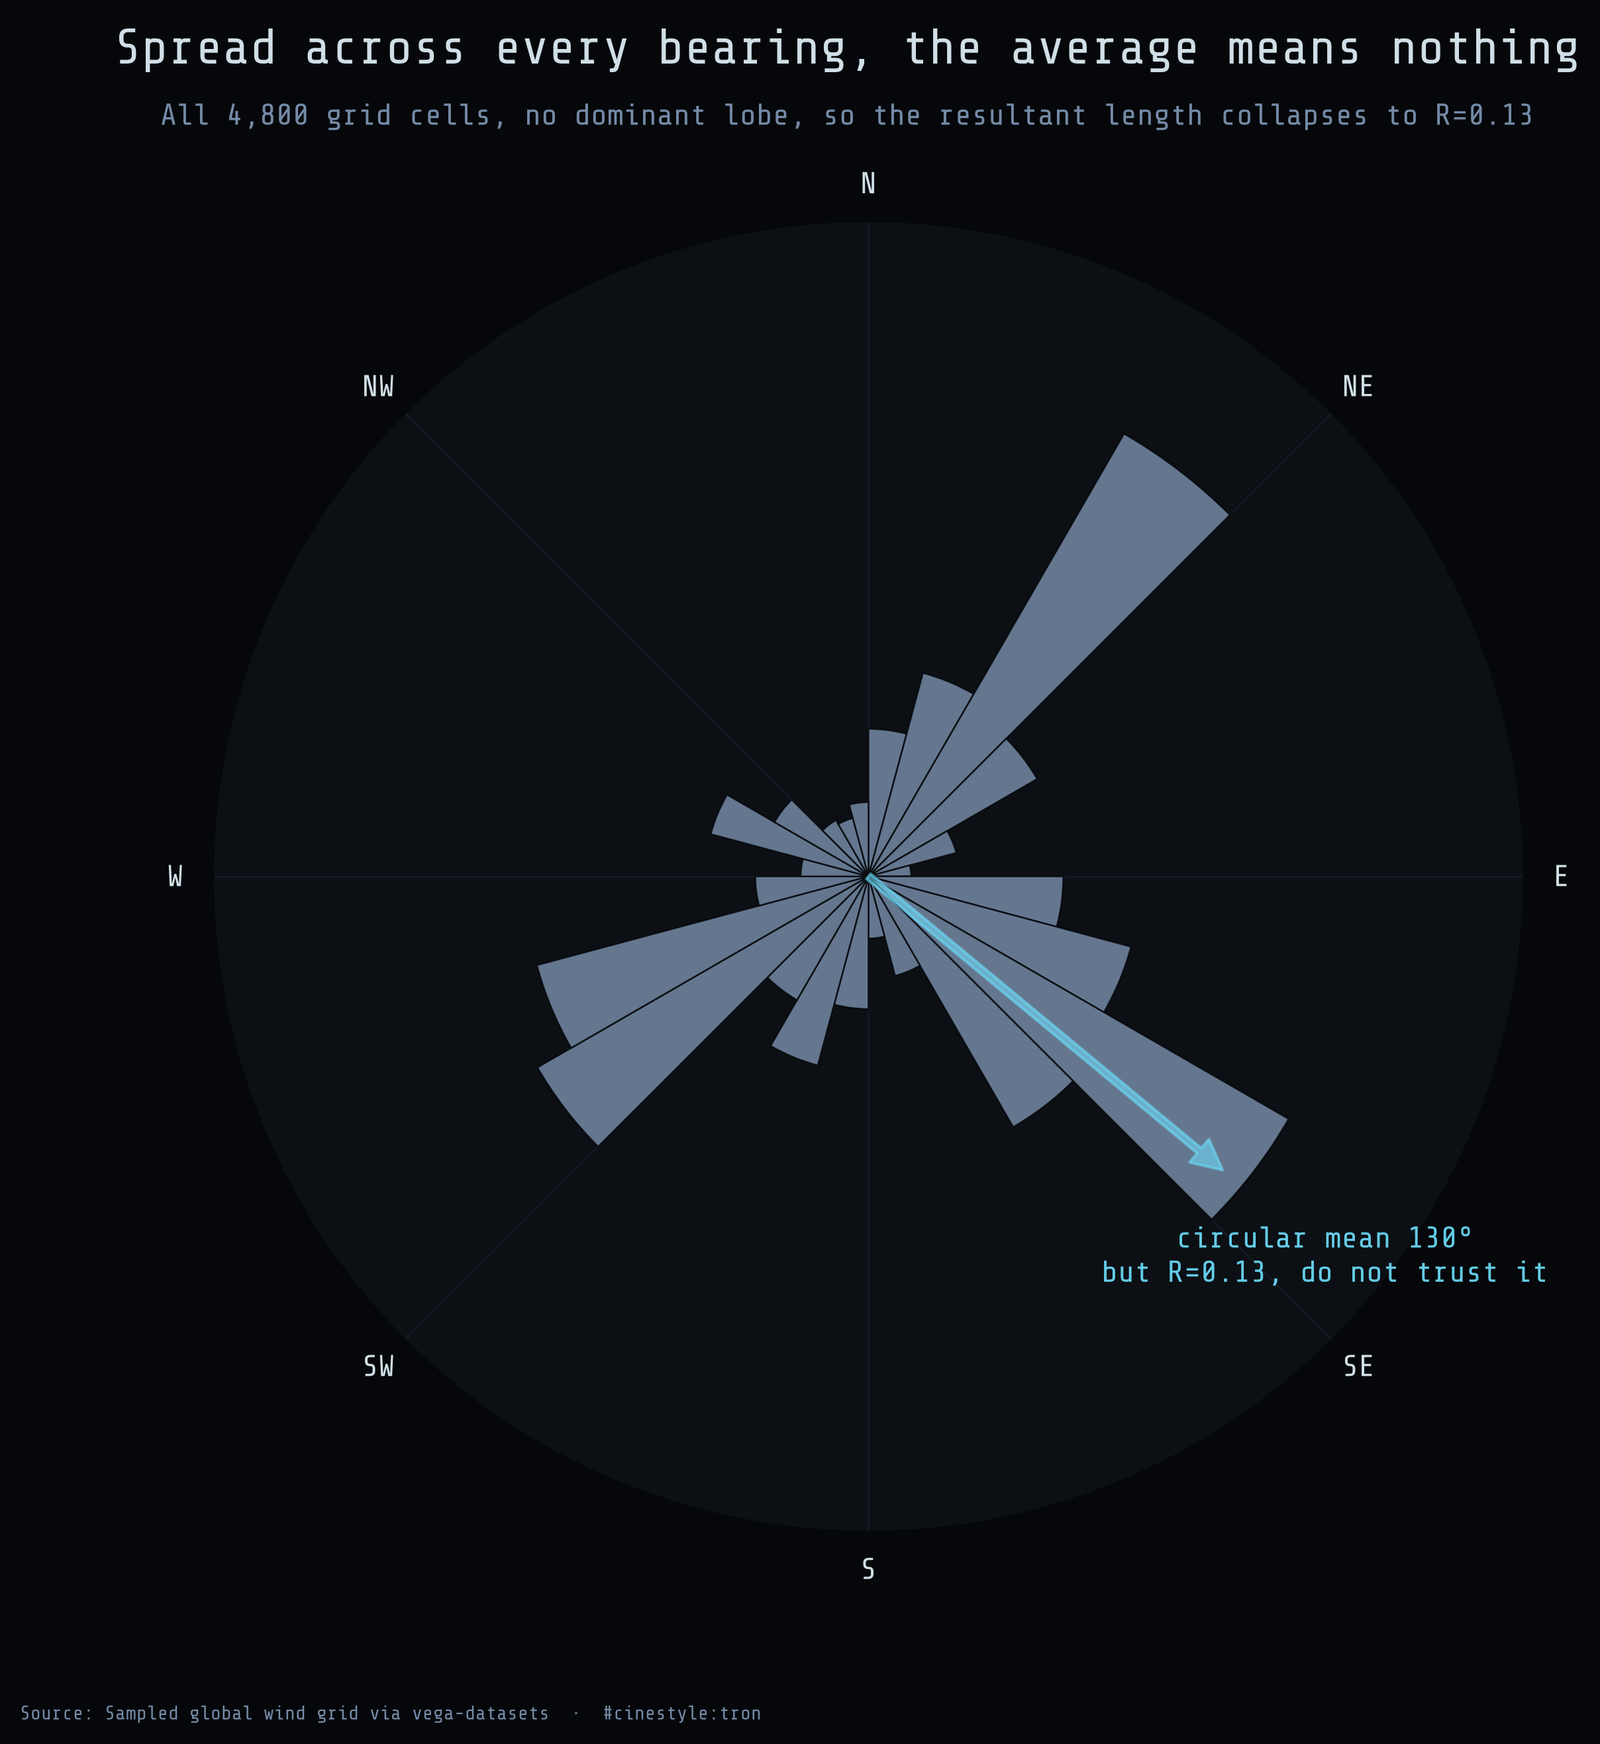
The wind rose for the full field shows why R is so low: the bars spread across most of the compass with no single dominant lobe. The circular-mean arrow is drawn on there too, but at R = 0.13 it is decoration, not a conclusion.
Does speed care about direction?
Last question, and the one I expected to be a shrug. I grouped mean speed by the dirCat sector and the spread is wider than I would have guessed. The fastest sector is 120 degrees, averaging 8.21. The slowest is 60 degrees at 2.30. That is a 5.9 gap, the fast sector blowing about three and a half times harder than the slow one, against an overall mean of 4.54.
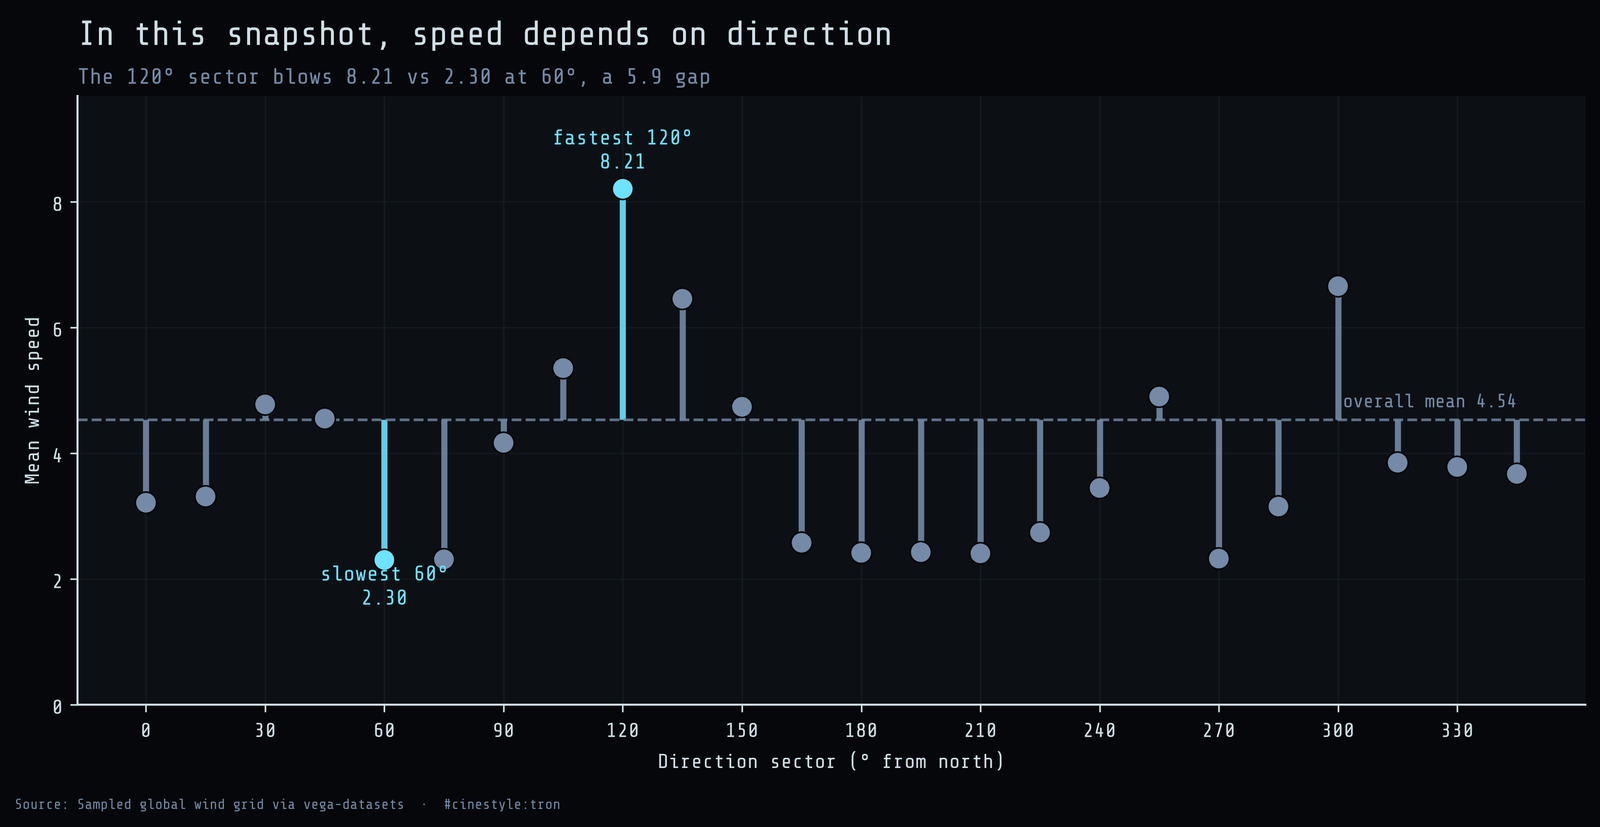
I want to be careful here. This is not a physical law of the atmosphere. It is a property of this gridded snapshot, where the fast cells happen to live in regions oriented around 120 degrees and the calm cells around 60. With spatially correlated grid points and no time dimension, I cannot tell you whether it holds tomorrow. But within the snapshot, direction and speed are plainly not independent. The calm sectors and the fast sectors point different ways.
The takeaway is narrower than “wind is interesting.” The moment your numbers wrap around, whether compass bearings, clock times, phases, or angles of any kind, df['col'].mean() is a bug, not an estimate. The grid here turned a 96-degree error into something you can see. Mean the sines and cosines instead, and check R before you believe the answer.