// article
How Exoplanets Cluster
Almost seven orders of magnitude, and the planets pile up at one end
The orbital periods in this catalog run from 0.09 days to 730,000 days. That is 6.91 orders of magnitude between the fastest planet and the slowest: one whipping around its star every two hours, another taking two thousand years. Put both on a linear axis and you see nothing. The fast one is a vertical line at the origin and everything else is a smear to the right.
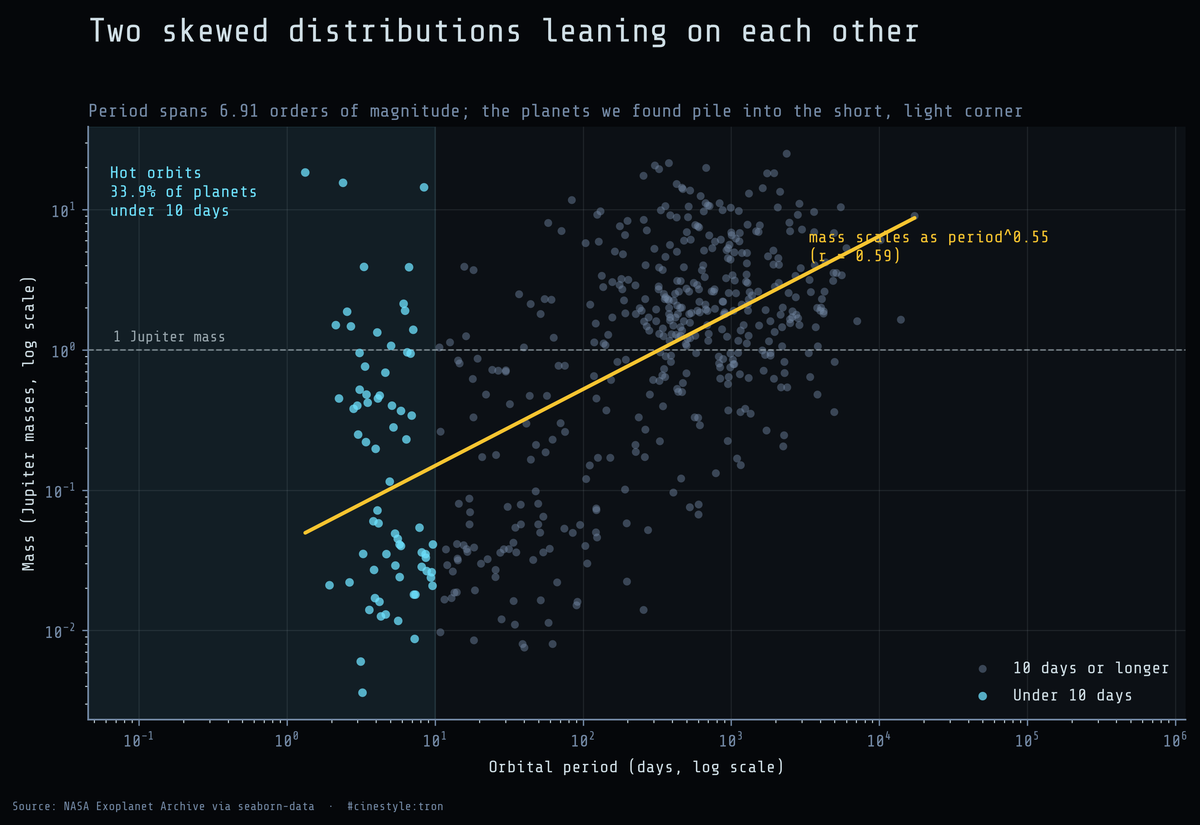
Each point is a planet we managed to both time and weigh. The shaded band on the left holds the 70 plotted planets that orbit in under 10 days, and the cloud thins out toward the slow giants on the right. Across all 992 planets with a known period, the under-10-day share is 33.9%. The rest of this post takes the picture apart.
The data
I am using the planets table from the NASA Exoplanet Archive, served through seaborn-data: 1,035 confirmed planets, six columns. Two matter here, orbital period in days and mass in Jupiter masses. This is a 2014-era snapshot, so it is a picture of what we had confirmed by then, not the current count. It is also missing a lot. Period is absent for 43 planets (4.2%), which is mild. Mass is absent for 522 of the 1,035 (50.4%), which is not. Every number about mass below comes from the 513 planets that have one, so read it as “the half we could weigh,” not the population.
One thing I did not expect: every planet with a mass also has a period. The mass column is a strict subset. The 513 planets with both measured are exactly the 513 with a mass at all.
The pile-up
Here is the period distribution with a logarithmic x-axis.
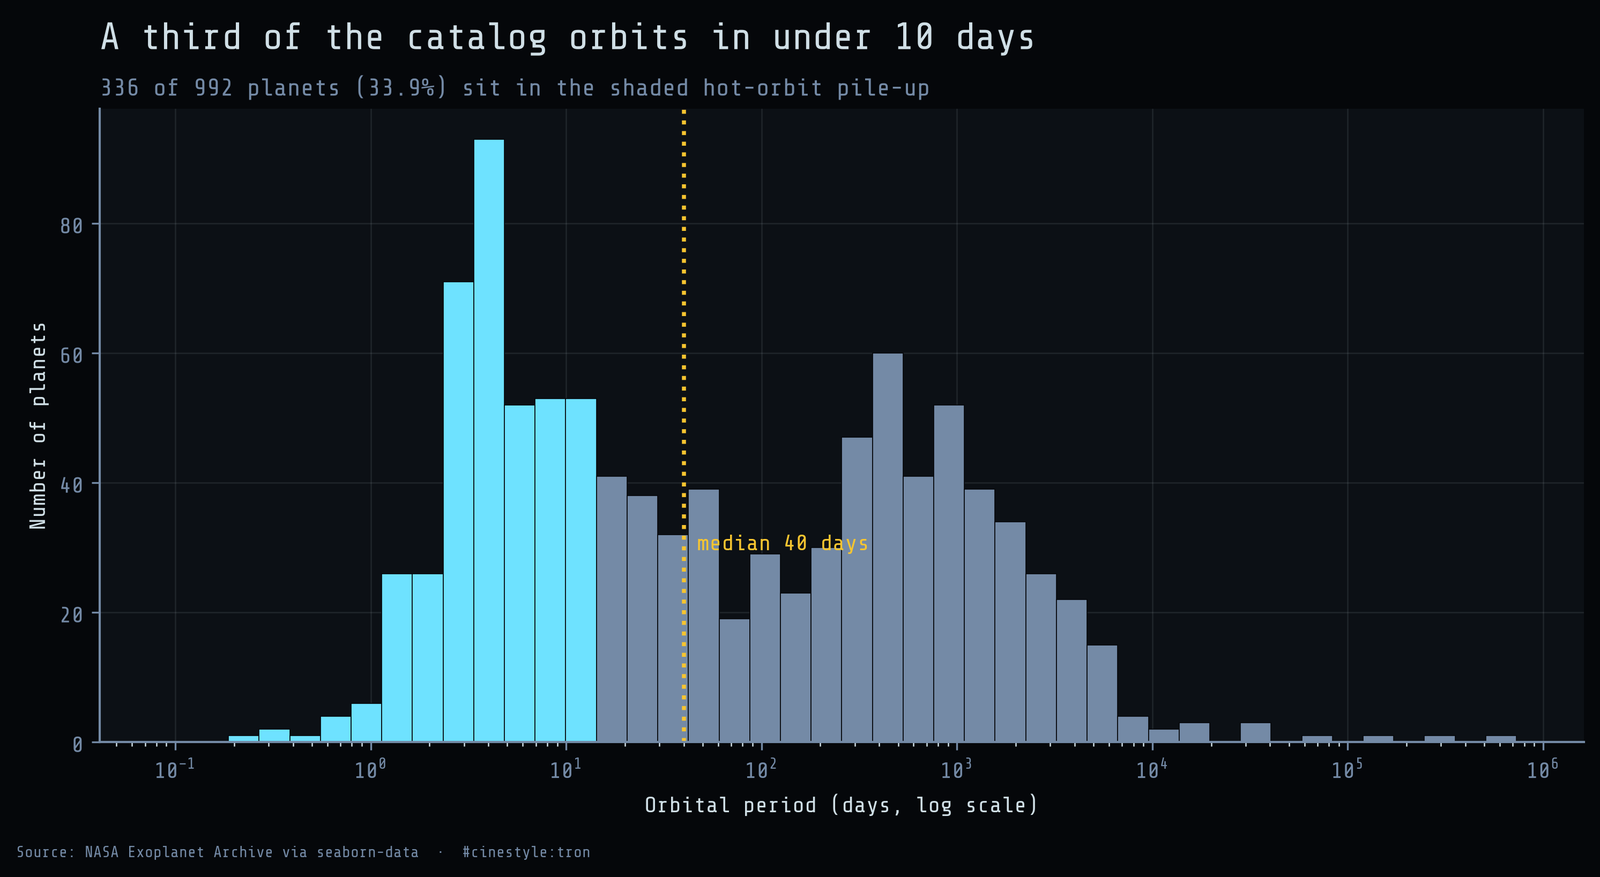
The median orbital period is 40 days. But the median undersells the lump. The single tallest bin sits between 3.2 and 4.8 days, 102 planets packed into one narrow slice. A third of the planets with a known period (33.9%, 336 of 992) orbit in under 10 days. Push the line out to 100 days and you have swept up 57%, more than half of every planet with a known period.
These are the hot Jupiters and their smaller cousins: big planets parked absurdly close to their stars, close enough to be roasting. Some of that pile is real. Close-in giants exist, and they are a genuine and slightly weird feature of planetary systems. But a lot of it is us. The closer a planet hugs its star, the more often it transits and the harder it yanks on that star, so both workhorse detection methods tilt toward short periods. The pile-up is part planet, part telescope. I cannot cleanly separate the two from this table, and I will not pretend I can.
What the log axis does is make the long tail legible. A thin scatter of planets stretches past 1,000, past 10,000, all the way to that lone 730,000-day object. On a linear plot they do not exist. On a log plot they are a faint, real population: the wide-orbit planets only the rarer methods can reach. The axis you pick decides which planets are allowed to be visible.
The masses are log-normal, almost
Mass tells a quieter version of the same story. Median mass is 1.26 Jupiter masses, with an interquartile range from 0.23 to 3.04, so the middle half of weighed planets spans an order of magnitude on its own. The full range runs from 0.0036 to 25 Jupiter masses, about 3.84 orders of magnitude. Narrower than period, but still wide enough that a linear histogram is mostly empty space with a spike on the left.
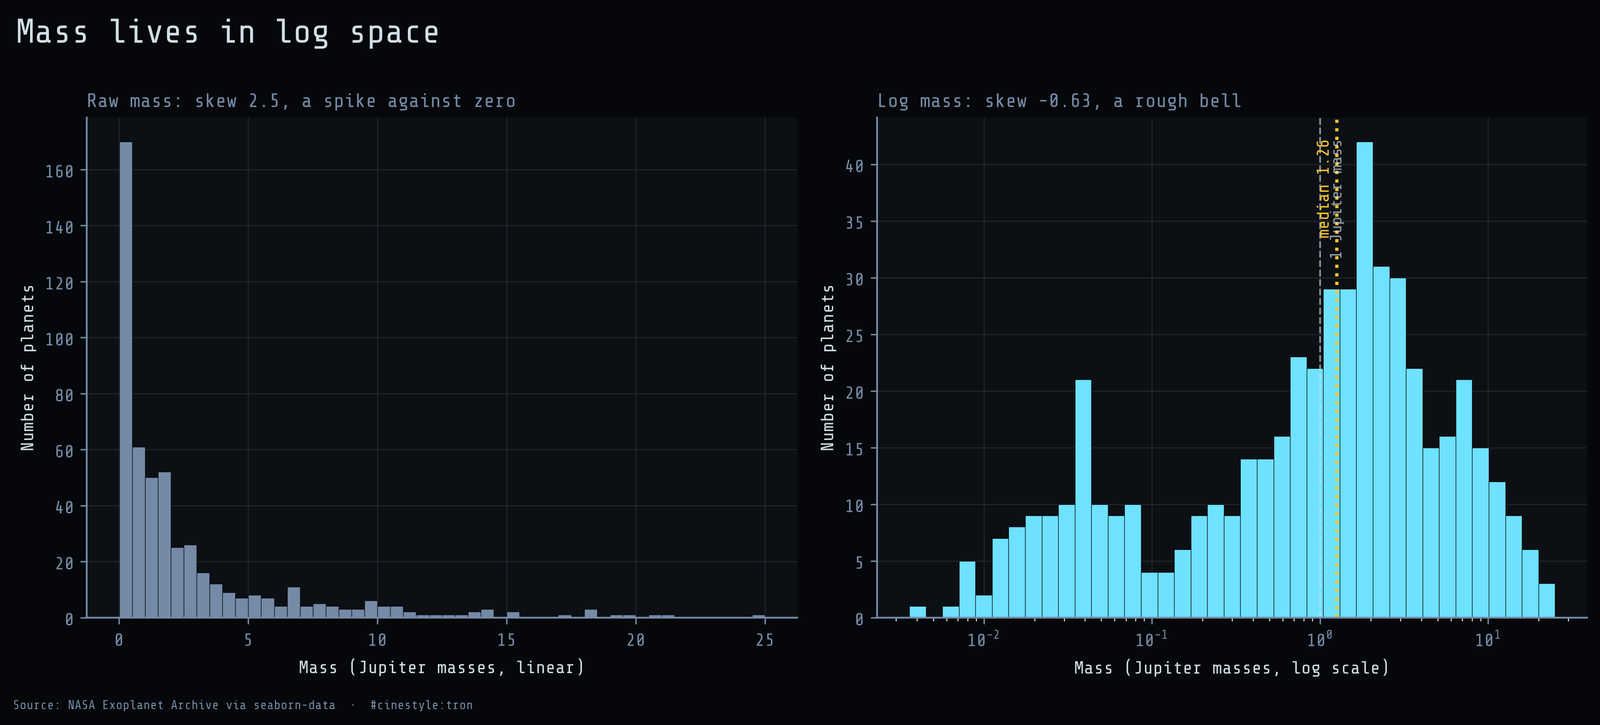
Left panel, raw mass: skew of 2.5, a textbook right-skewed pile against zero. Right panel, the same masses on a log axis: skew drops to -0.63 and the thing turns into a rough, slightly left-leaning bell. I ran Shapiro-Wilk on both to put a number on the eyeball. Raw mass gives W = 0.68 (p about 7.6e-30), emphatically not normal. Log mass gives W = 0.94 (p about 1.5e-13). Better, but that p-value still rejects normality, so the masses are log-normal-ish rather than clean log-normal, with a heavy enough left shoulder to fail the test. And the test is strict: with 513 points Shapiro will reject for departures too small to matter. Calling the masses log-normal would be the lie that is almost true. I will say it lives naturally in log space, and you should stop fighting it.
One more count: 282 of the 513 weighed planets, 55%, are heavier than Jupiter. The other 231 are lighter. That is the radial-velocity bias showing through, because it is easiest to weigh a heavy planet, but it is a striking thing to see in a catalog where Jupiter is our own system’s giant. More than half the planets we could weigh outweigh the biggest thing orbiting our Sun.
Where the two distributions meet
Put period on one log axis and mass on the other, for the 513 planets with both. The flagship at the top shows the split version; here is the plain cloud with the fit.
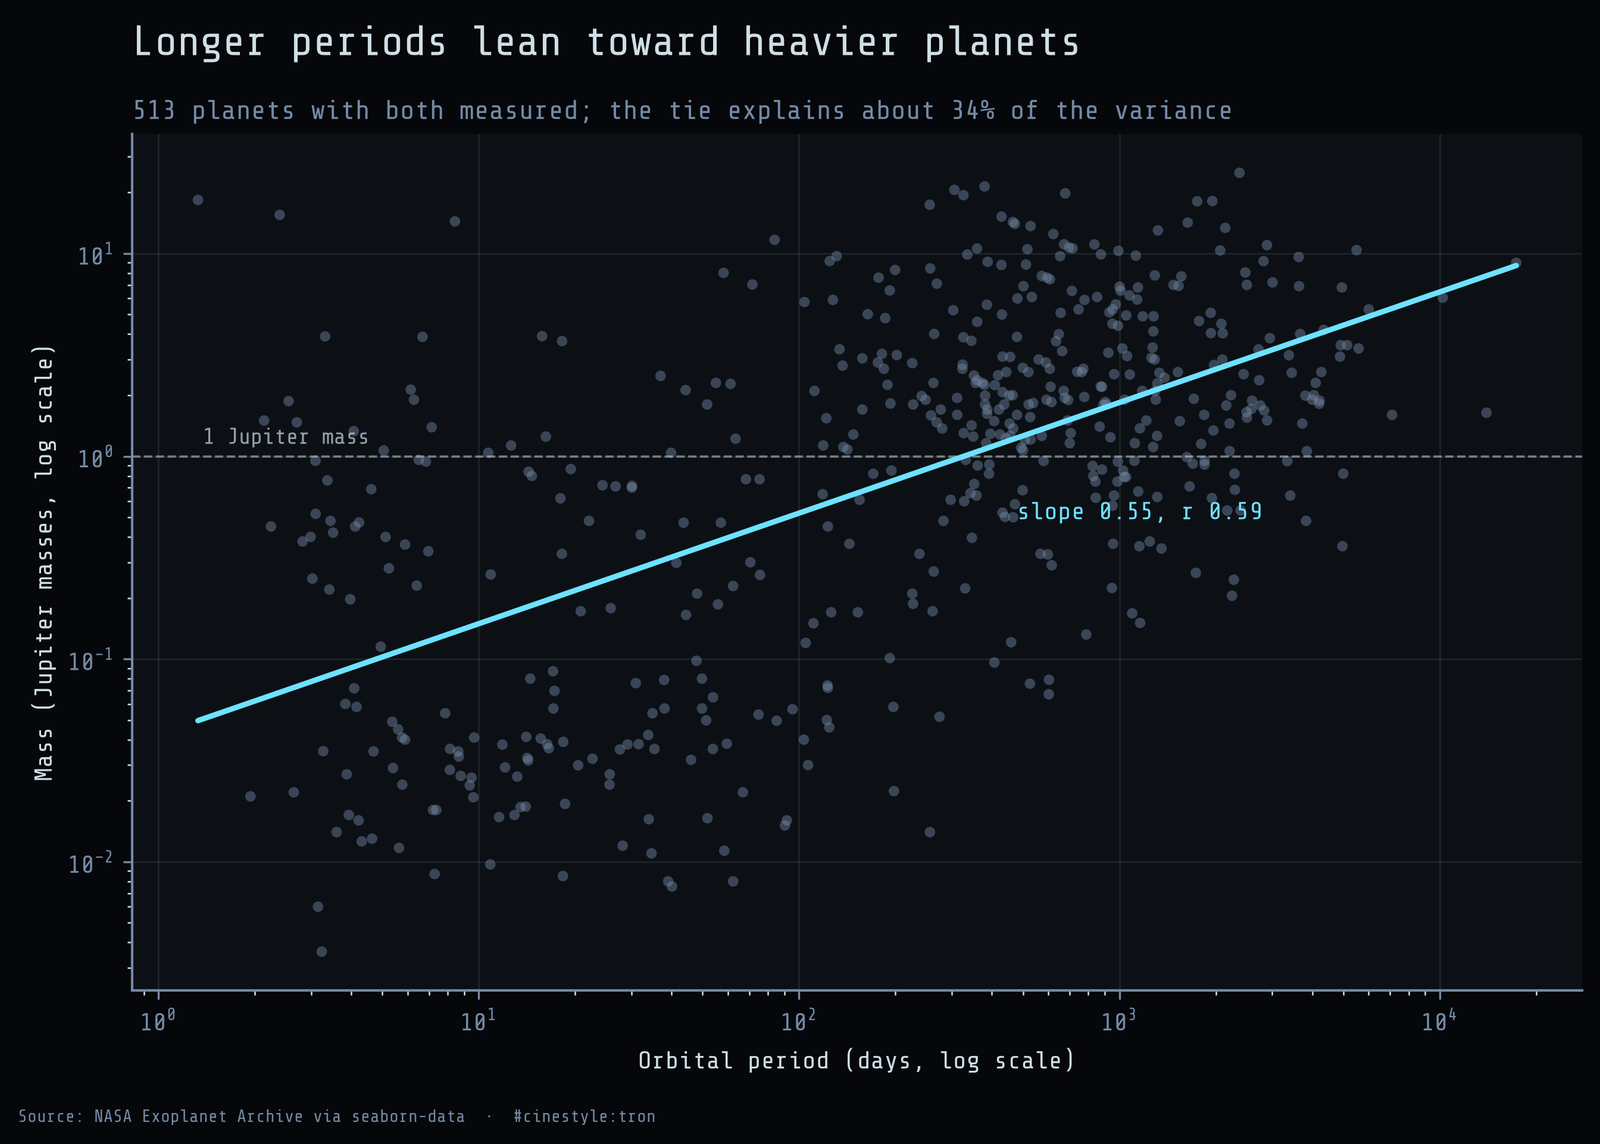
There is a real relationship in here. Pearson’s r on the logged values is 0.59; Spearman, which does not care about the log transform, is 0.54. Both say longer-period planets tend to be more massive. The fitted slope is 0.55, so in log-log terms mass scales roughly with the square root of period. The slope traces the edge of what we could detect, not a law of nature. Short-period planets crowd below the one-Jupiter line because the close-in, easy-to-find planets include a lot of lighter ones. The hot-orbit group has a median mass of just 0.09 Jupiter masses, against 1.56 for the rest. The long-period detections that survived to 2014 are mostly heavy, because a far-out planet had to be big to register at all.
r = 0.59 means the period-mass tie explains about a third of the variance and leaves two-thirds to scatter. You can see it: at any given period there is more than an order of magnitude of mass spread. It is a tendency, not a track.
Two skewed distributions, leaning gently on each other, neither willing to behave outside of logarithms. The planets crowd the short-period, sub-to-few-Jupiter corner and thin out toward the long slow giants. Half the catalog never got weighed, so half of what I just said about mass rests on the easy-to-weigh half. Switch the axes back to linear and almost all of it collapses into a spike at the origin. That is the best argument I know for why astronomers reach for a log scale before they reach for anything else.