// article
Titanic Families
The Titanic's loneliest passengers, and its largest families, drowned together
A family of four on the Titanic survived at 72 percent. A family of eight survived at zero. All six of them died, and so did all seven members of the eleven-person family who appear in this dataset. Between those two points sits a curve that rises, peaks, and falls off at both ends.
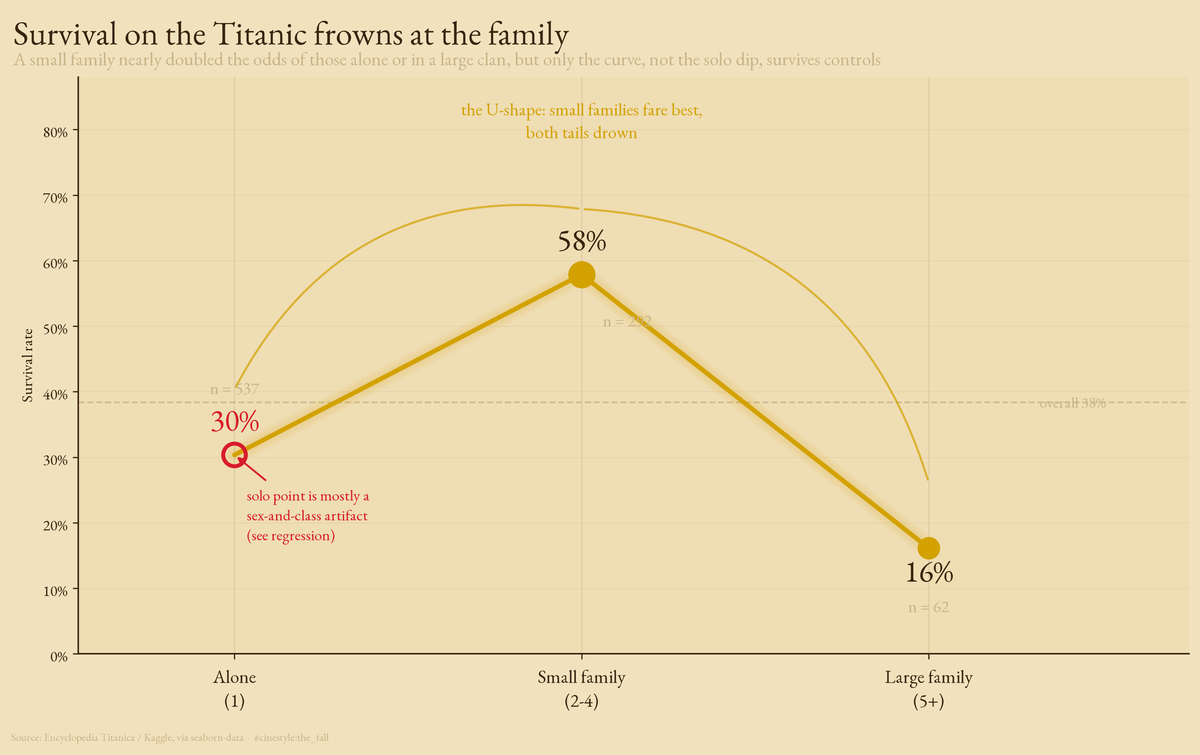
The small-family bin nearly doubles the survival odds of the people on either side of it, and that hump holds up after you control for sex and class. The solo dip is the part you cannot trust on its own. It is flagged in red because, as the regression shows, most of it is young men in cheap cabins wearing a family-size disguise.
I have pulled this dataset apart twice before. Once to weigh sex against class, once to watch a random forest tie a logistic regression and lose. Both times the story was the same two variables, sex and class, doing all the work. This time I wanted a variable they did not touch: how many people you were traveling with. The Titanic set ships with two raw columns for that, sibsp (siblings and spouses aboard) and parch (parents and children aboard). Add them, add one for the passenger, and you get family_size. It ranges from 1 to 11 across all 891 rows. The source is the usual one, Encyclopedia Titanica via Kaggle, the training subset bundled into seaborn.
A frown, not a slope
If family meant help, someone to pull you toward a boat or someone the crew would usher aboard together, survival should climb with family size. It does not. Picture a sliding scale where one passenger is the floor and a clan of eleven is the ceiling: survival does not rise across it, it humps in the middle and falls off both ends.
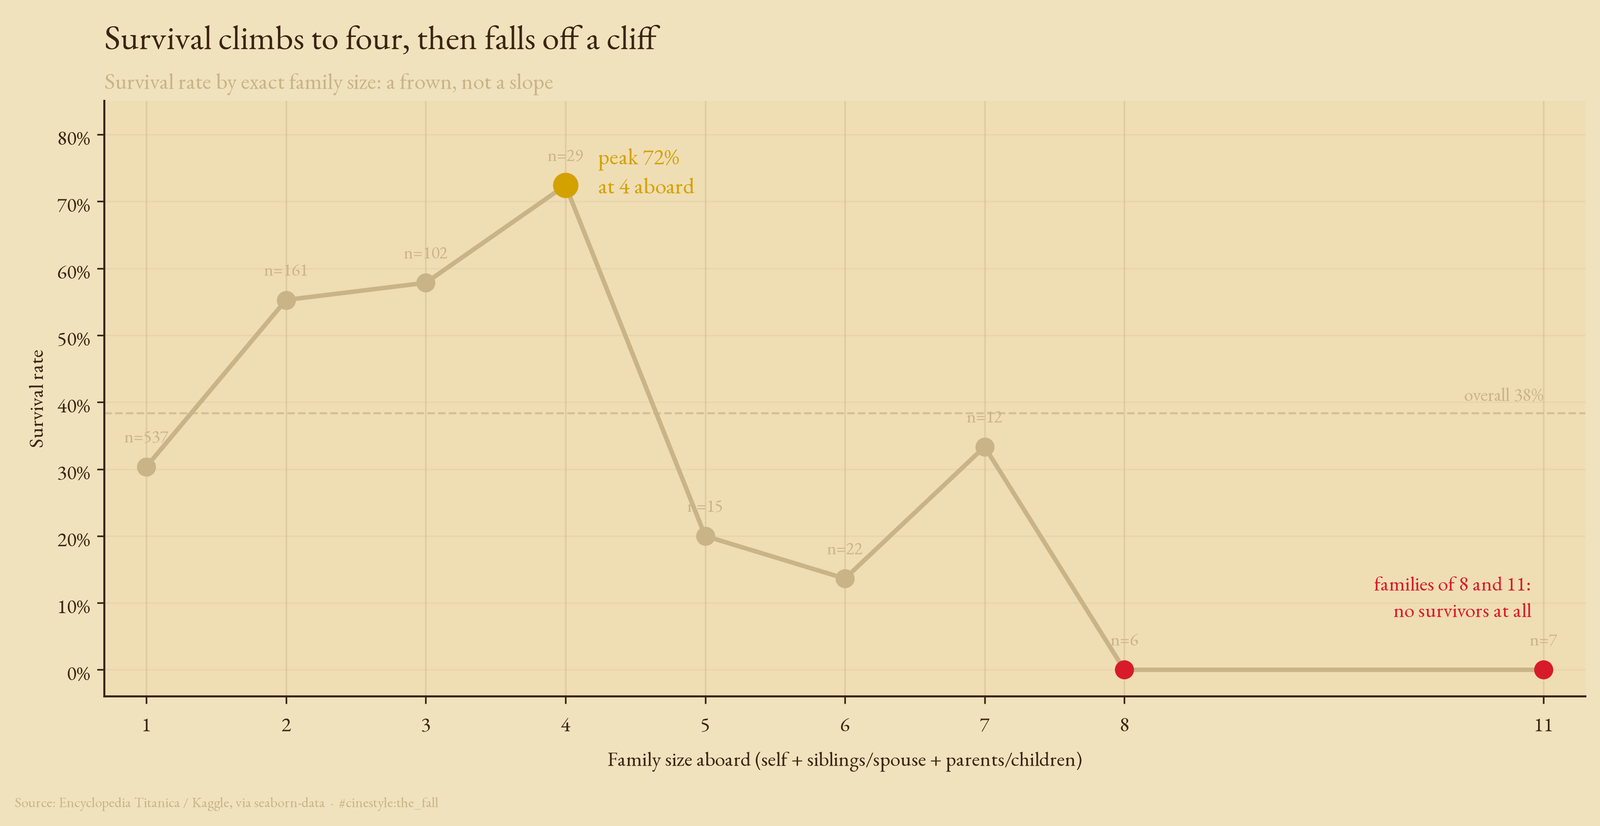
The numbers, exact: a solo traveler survived at 30 percent, 537 of them, the largest group by far. Two aboard, 55 percent. Three, 58 percent. Four, 72 percent, the peak, though only 29 passengers sat there. Then it collapses. Five aboard, 20 percent. Six, 14 percent. Eight, zero out of six. Eleven, zero out of seven. The overall survival rate was 38 percent, and both tails of this curve sit well below it.
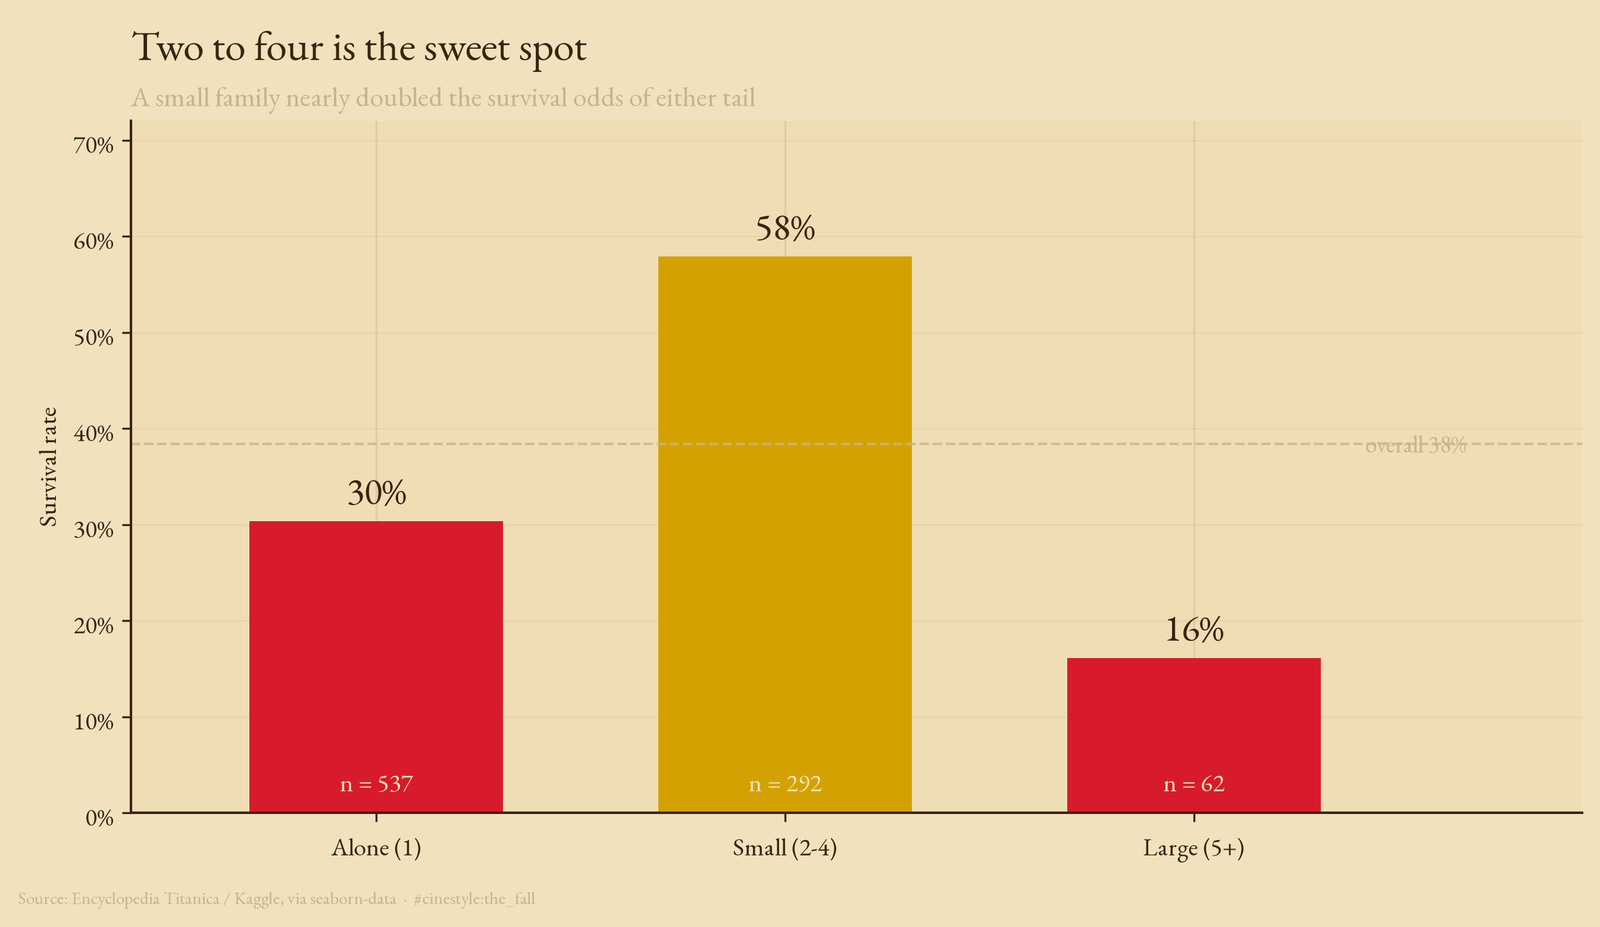
Collapse the curve into three bins and the shape gets blunt. Traveling alone: 30 percent survival across 537 people. A small family of two to four: 58 percent across 292. A large family of five or more: 16 percent across 62. The middle bin nearly doubles the odds of the people on either side of it.
The large-family tail is easy to read, even if it is thin. If you are herding six children across a tilting deck at night, you are not getting all of them into a boat. At family size eight, all six died, a small cell I will not lean on too hard. Family size seven is the exception at 33 percent, but that is 12 people, and it still sits below the 38 percent overall rate. Size past four did not buy safety; it bought a longer line of people you could not save.
The alone penalty is mostly a costume
Solo travelers died at a 20-point higher clip than passengers with family aboard: 30 percent survival alone, versus 51 percent with at least one relative. That looks like a clean penalty for being alone. But I had been burned by this dataset before, so I asked the obvious question first. Who were the people traveling alone?
They were 77 percent male and 60 percent third class. Passengers with family aboard were 47 percent male and 47 percent third class. The solo travelers were disproportionately the exact people this ship killed regardless of family: young men in cheap cabins. The alone penalty might be the sex-and-class penalty wearing a different hat.
So I split alone-versus-not inside each sex, and the apparent penalty fell apart.
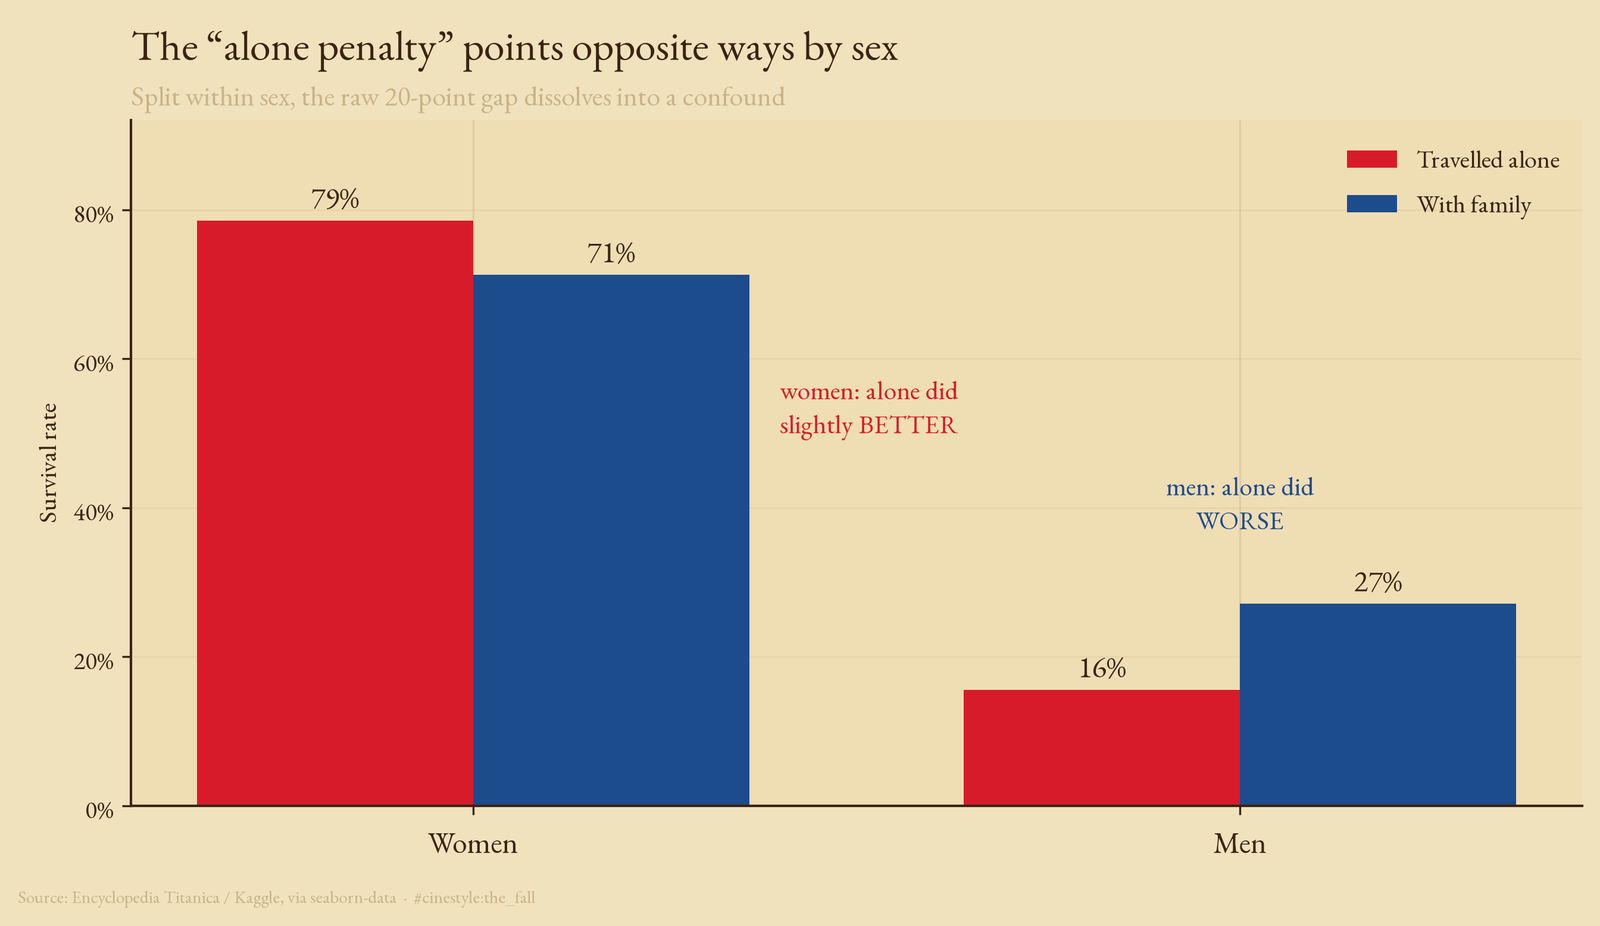
Among women, traveling alone was not a penalty at all. Solo women survived at 79 percent; women with family aboard, at 71 percent. The alone women did slightly better. Among men it flips: solo men survived at 16 percent, men with family at 27 percent. The 20-point raw gap was real arithmetic, but it was an average smearing two opposite effects together, weighted toward men because men were 77 percent of the solo travelers. Think of it as adding a hot tap and a cold tap and reporting the drain temperature. Pool the sexes and you manufacture a penalty that exists for one and reverses for the other.
The regression closes the case. Survival regressed on the alone flag alone gives an odds ratio of 0.43, so being alone roughly halves your survival odds, with a p essentially zero. Add sex and class as controls and the alone coefficient evaporates: odds ratio 0.91, p of 0.61, statistically indistinguishable from no effect. Meanwhile in that same model female carries an odds ratio of 13.7 and third class drops odds to 0.15, the same two giants from the last two posts. The lone-traveler story was their shadow.
But the curve itself is real
The alone penalty is a confound, but the curve itself survives the same controls.
A binary alone flag cannot see a hump. It lumps the 30-percent solo travelers and the 16-percent large families into the same direction only by accident. So I fit family size as a continuous term plus its square, controlling for sex and class. The linear term comes in positive at 0.74 (p of 0.002) and the squared term negative at -0.13 (p of 0.0004). A positive linear term with a negative square is the algebra of a hump: survival rises with family size, then turns and falls. Both terms clear significance comfortably, after sex and class are already in the model. The turning point lands at a family size of 2.8, right in the small-family bin where the raw curve peaked.
Family structure does carry information that sex and class do not already encode. The pattern is not that being alone is dangerous. A family of two to four helped, and past four the help turned into harm. A spouse or a child or two, the kind of small unit the lifeboat protocol could keep together, nudged the odds up. A clan of eight or eleven could not be kept together, and the data shows it in two rows of zeros.
One caveat I will keep honest, the one shadowing every post built on this set. It is 891 observations, it is observational, and the large-family bin rests on a few dozen people in single-digit cells. The alone flag is so tangled with sex and class that I trust the regression over any cross-tab. If you remember one thing: the headline that solo passengers were doomed is a sex-and-class artifact that disappears under control. The gentler claim, that a small family helped and a large one hurt on top of everything else, is the one that survives the curve being allowed to bend.