// article
Who Survived the Titanic
Women and children first, or first class first?
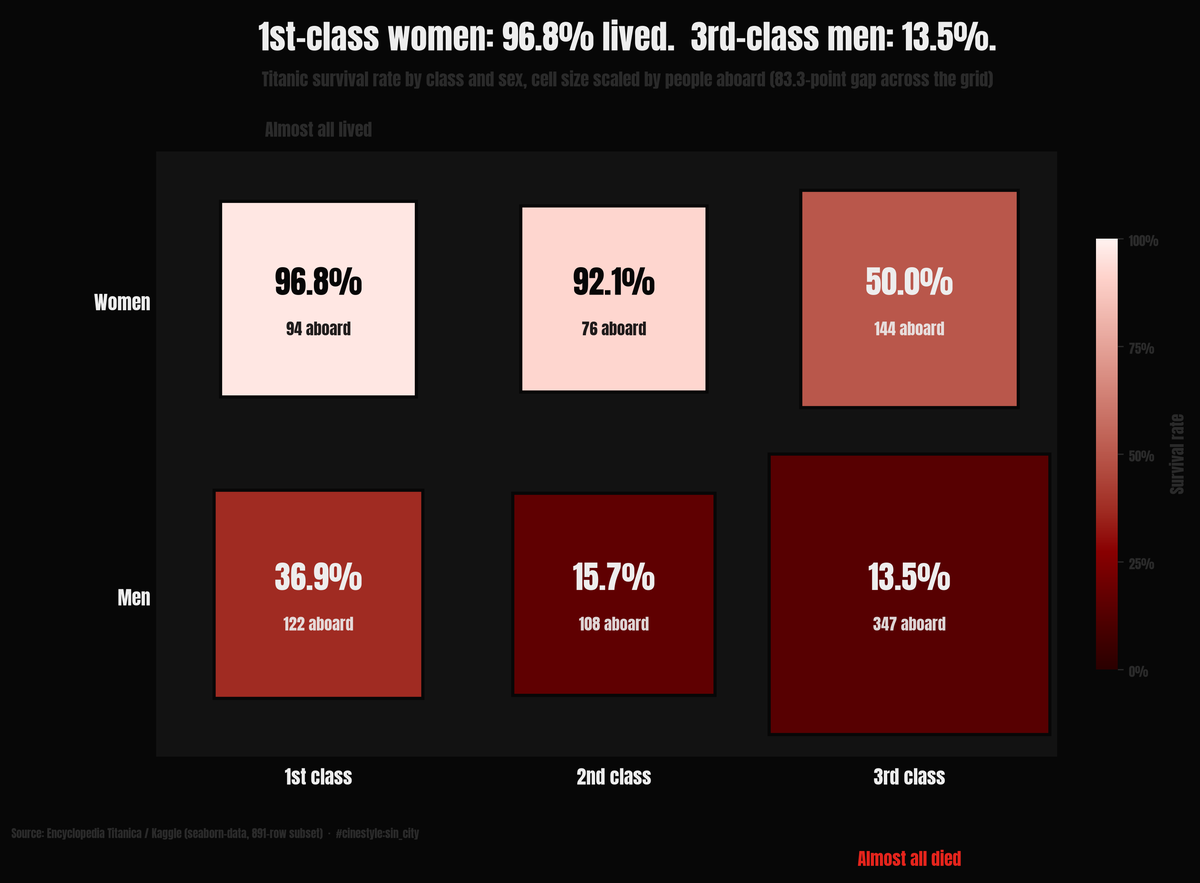
Read that grid corner to corner. First-class women in the top-left, pale, almost all alive. Third-class men in the bottom-right, the biggest cell on the board and soaked in red, almost all gone. The deeper the red, the higher the death rate. That diagonal is the question this post answers.
Almost every woman in first class lived: 97 of every 100. Among the men down in third class, 14 did. Same ship, same black water, same night in April. The survival rate between those two corners of the passenger list is 83 points apart.
That gap frames the fight. “Women and children first” is the story everyone repeats about the Titanic. But the ship was also a stacked class system, and the cheap cabins sat low, near the waterline, far from the boats. So when I pulled the 891-passenger Titanic set (Encyclopedia Titanica via Kaggle, the well-worn training subset that ships with seaborn), I wanted to know which lever actually moved the odds: being a woman, or being able to afford a stateroom. The two are tangled, and pulling them apart is the interesting part.
The two raw gaps are both enormous
Overall, 38% of these passengers survived. Split by sex, the gap is brutal: 74% of women lived, against 19% of men. A chi-square on sex versus survival lands at p around 1e-58, which is the statistical way of saying this is not luck.
Split by class instead and you get another wide gap, just less extreme. First class survived at 63%, second at 47%, third at 24%. Both cuts look true at once, which is the problem.
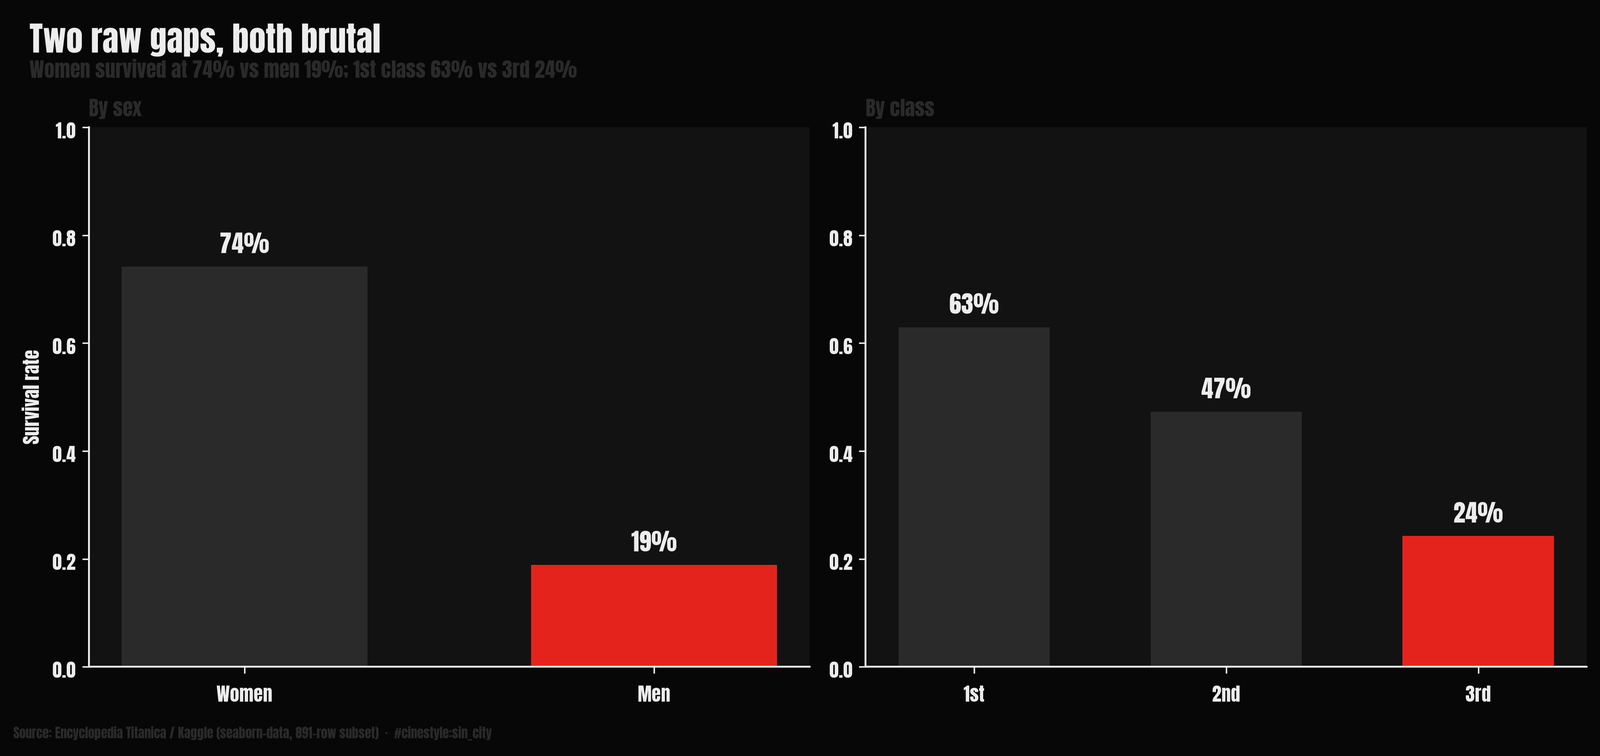
The trap is that these two cuts are not independent. If first class happened to be mostly women, the class effect might just be the sex effect wearing a top hat.
So I checked the composition
It is a real confound, but smaller than I expected. First class was 44% female, second 41%, third 29%. Third class skewed male, but no deck was anywhere near all-women. First class was 56% men, and they still had good odds.
That already tells me the class gap cannot be pure composition. To see how much survives, the cleanest move is to look inside each sex-and-class cell.
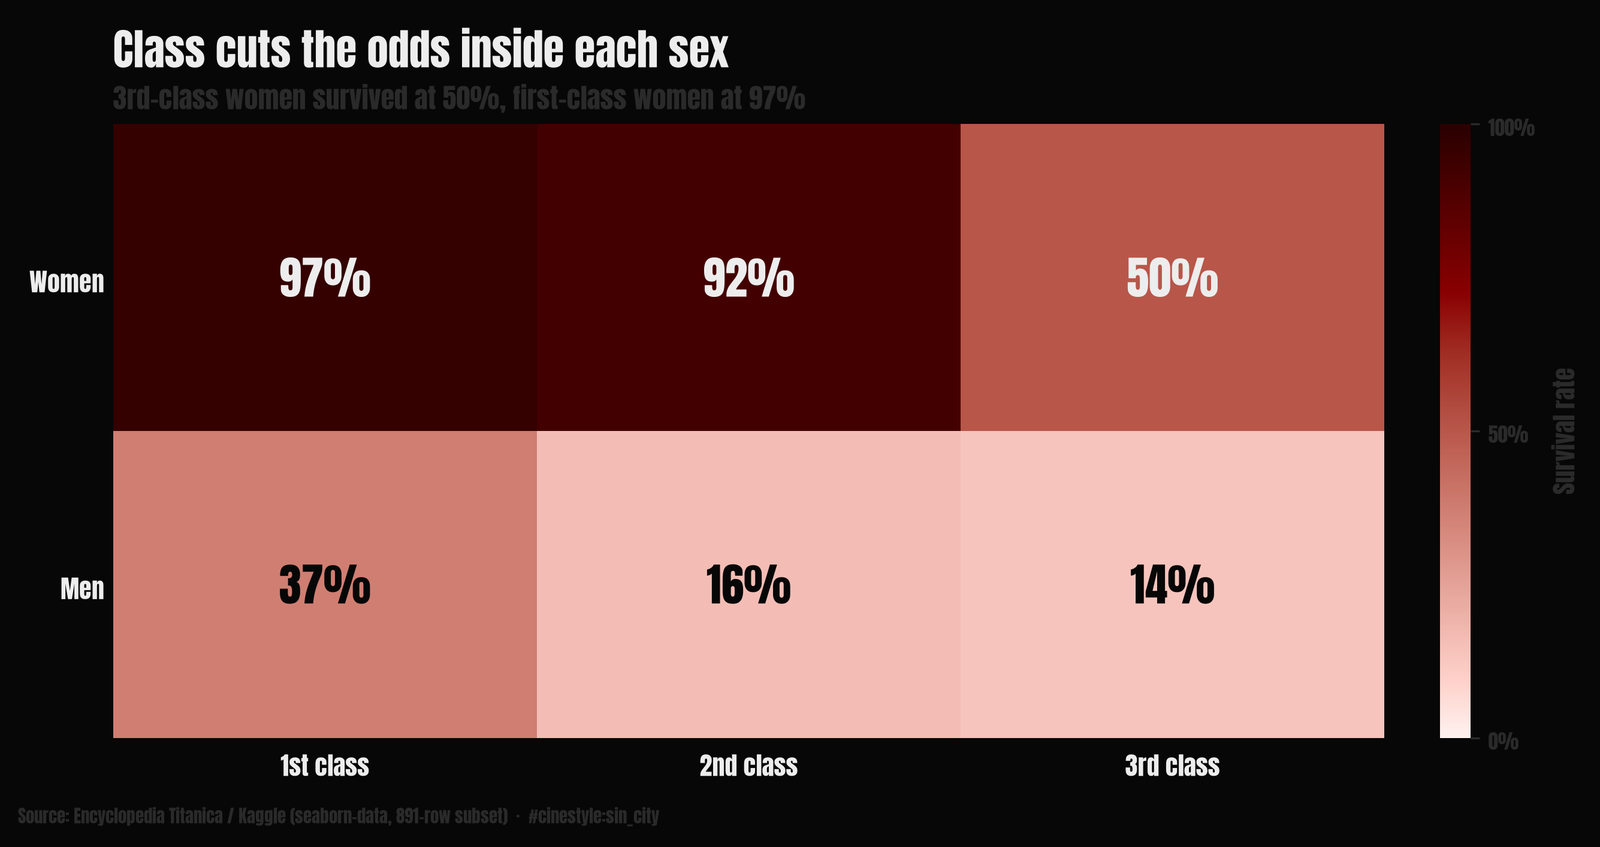
Here is where it gets stark. First-class women survived at 97%. Third-class women, at 50%. Same sex, half the survival rate, and the thing that changed is the class of ticket. Among men: 37% in first class, 14% in third. Class moves the odds within each sex by a huge margin. Being a woman helped everywhere, but it did not help equally: a third-class woman at 50% sat far above a third-class man at 14%, and far below a first-class woman at 97%. The protocol reached women across every deck. The floor plan still favored the ones who could pay.
Letting a model hold one constant while it varies the other
Cross-tabs are honest but they run out of cells fast. To get the partial effect, sex with class held fixed and class with sex held fixed, I fit a logistic regression on sex, class, age, and fare.
One caveat first, because it matters. Age is missing for 177 of the 891 rows, about 20%. That is not a rounding error. So I ran the model twice: once on the 714 complete cases, and once on all 891 with age filled at the median (28.0 years). I will quote the imputed model and flag where the two disagree, which is barely.
The imputed fit gets a McFadden pseudo-R squared of 0.32 and 79% accuracy under 5-fold cross-validation. Not a crystal ball, but it is catching real structure. The odds ratios:
- Female: 13.6. Holding class, age, and fare fixed, a woman’s odds of surviving were about thirteen times a man’s. On complete cases it is 12.4. Either way, sex is the single biggest lever, and controlling for class does not dent it.
- Pclass: 0.32. Each step down in class (1 to 2 to 3) multiplied the odds of survival by 0.32, roughly a two-thirds cut per rung. Moving from first to third stacks that twice. Class survives the controls intact; the complete-case model agrees at 0.28.
- Age: 0.97 per year. Pointed the way the slogan predicts: each extra year trimmed the odds about 3%, so younger passengers fared better. Age enters the model as a straight line, so it cannot show a cutoff where “children” ends.
- Fare: 1.0006. Basically nothing once class is in the model. Fare and class are nearly the same variable; class absorbs the signal and fare has nothing left to explain.
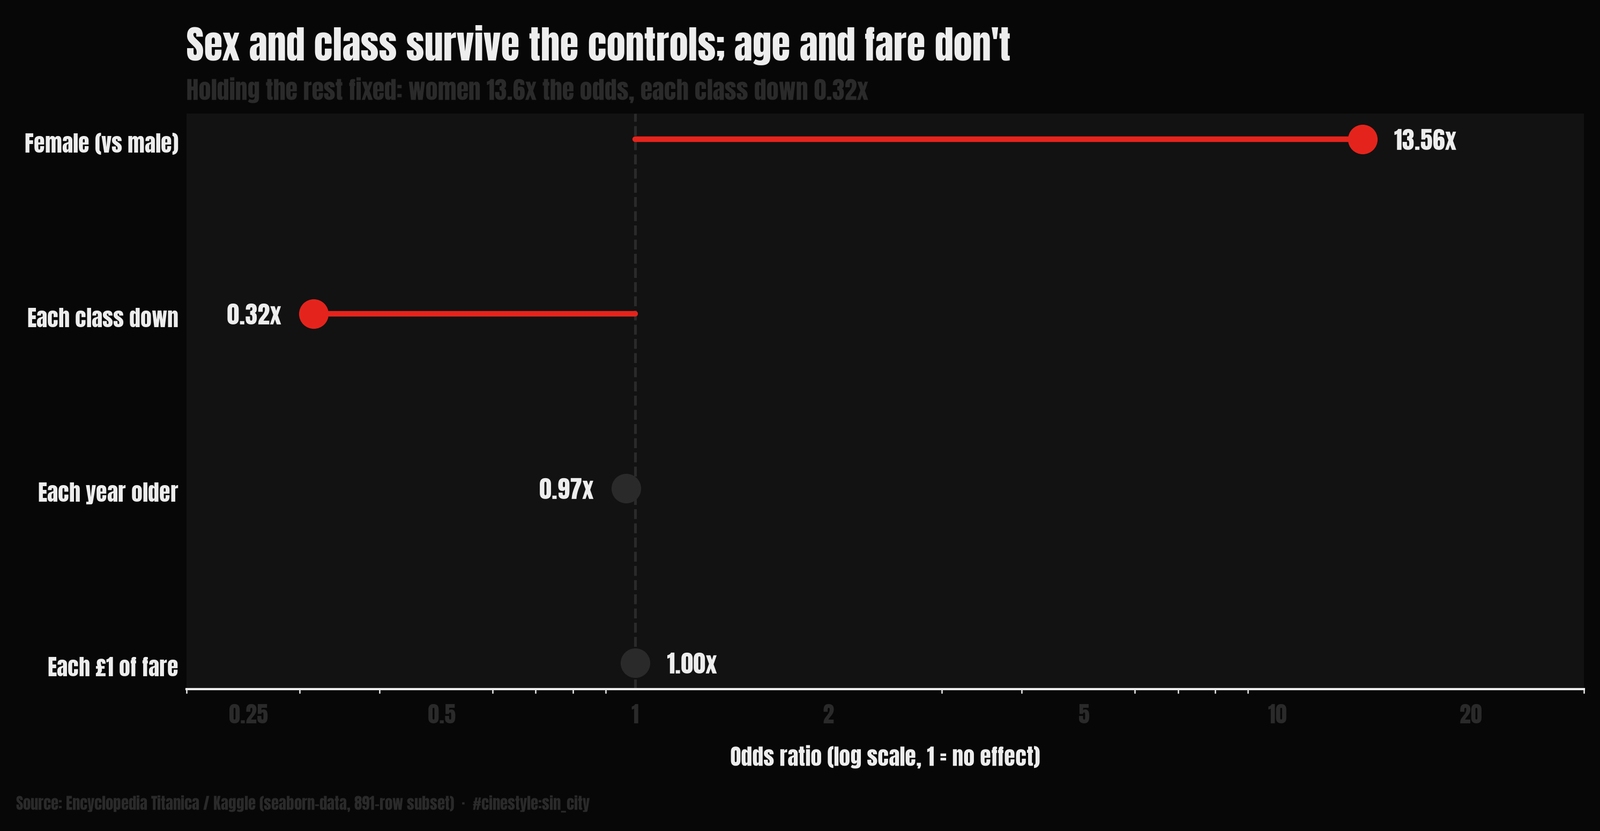
The odds-ratio chart is on a log scale, and the asymmetry jumps out: the female bar runs far to the right of 1, the pclass bar sits well left of it, and age and fare hug the line. Sex and class carry the model while age and fare barely register. Nothing here is causal: this is who lived, not why each one did. The lifeboat protocol, cabin location, and crew behavior are all baked into these associations, not separated by them.
What actually moved the odds
So, which lever? Both, and the honest answer is that the framing is a little off. Sex carried the larger coefficient, a 13.6x odds multiplier nothing in the model touches, but class was not a confound that vanished under control. It held its own ground. A third-class woman at 50% survival is the proof: the protocol reached her, and the geography of the ship still cut her survival rate in half against a first-class woman.
The slogan was “women and children first.” The data says women, yes, emphatically. Children, somewhat: age pointed the right way, though it moved the odds far less than sex or class. And first, in a sense the White Star Line never put on a poster: first class.
One more honesty note. This is the 891-row training subset, not the full ~2,200-person manifest, and the imputed model leans on a median age for one passenger in five. The direction of every result is stable across both fits. I would not bet the third decimal place.