// article
Seattle Versus New York
Seattle rains on 10 more days out of every 100 than New York, and New York's rain falls harder
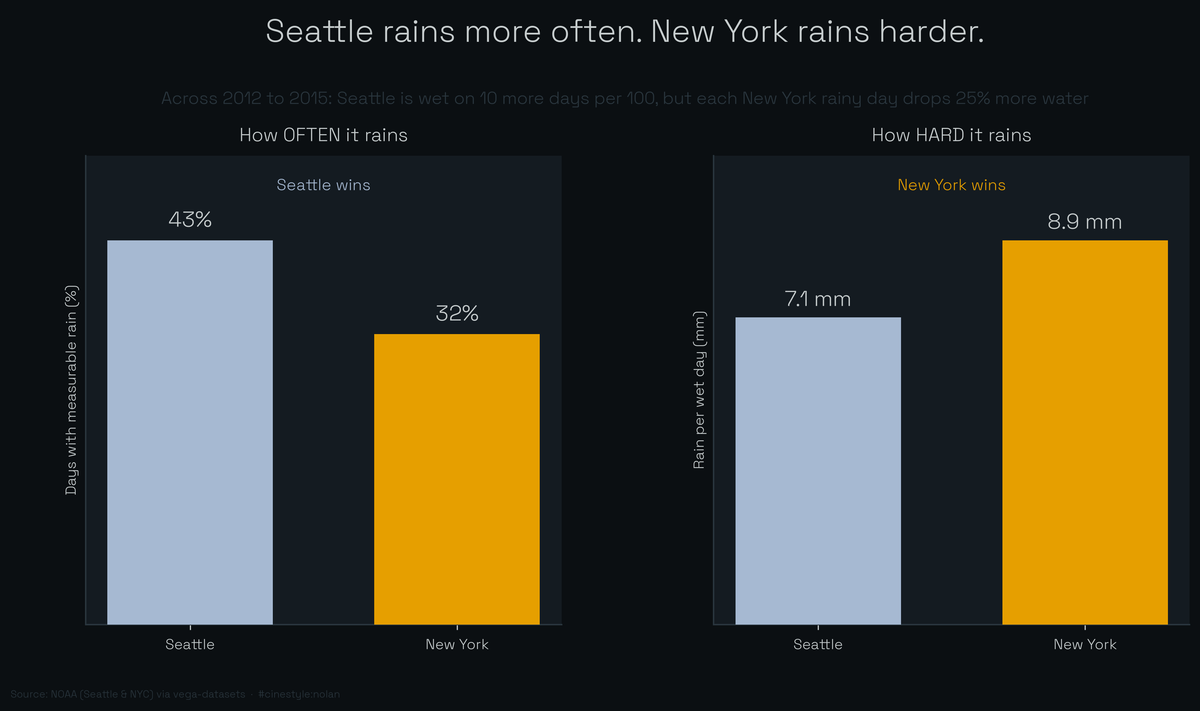
Seattle had measurable rain on 42.6% of days between 2012 and 2015. New York had it on 32.2%. That gap, about 10.5 percentage points, is roughly one extra wet day for every ten on the calendar. The reputation is right about that and wrong about how hard it rains.
The two cities trade places depending on which question you ask. Seattle wins on how often it rains; New York wins on how hard. The reputation gets the first half and quietly assumes the second.
I pulled the weather_two_city set from the project catalog: 2,922 daily rows, one station each for Seattle and New York, sourced from NOAA via vega-datasets. Each city contributes exactly 1,461 days, January 1 2012 through December 31 2015, with columns for precipitation (mm), daily max and min temperature (C), wind, and a coarse weather label. Four clean years, no missing days, perfectly balanced. I counted a day as wet at 0.25 mm (0.01 inch) or more, the standard floor for a measurable trace, so a few hundredths of a millimeter of fog drip do not register.
The frequency story is not subtle. Seattle logged 623 wet days out of 1,461. New York logged 470. Picture the calendar, not the cloud: in Seattle you reach for a jacket on close to nine days of every twenty, in New York on closer to six. The dataset’s own labels agree. Seattle’s days split almost evenly between rain (43.9%) and sun (43.8%), while New York is sunny 56.5% of the time and rainy only 30.5%. Seattle also carries more fog days (6.9% versus 2.6%). The gray reputation is earned in the count of days, not the depth of the puddles.
Where the water actually goes
Here is where I expected a clean inversion. Seattle rains often but lightly, New York rains rarely but hard, and New York ends up wetter overall. I had half-written that sentence before I checked the totals.
Over the four years Seattle accumulated 4,426 mm of precipitation. New York accumulated 4,178.6 mm. Seattle is the wetter city by total volume in this window, about 247 mm more. New York’s total comes to 0.94 of Seattle’s. On a mean-annual basis that is 1,106.5 mm for Seattle against 1,044.6 for New York. The tidy headline I went in expecting, that New York gets more total water, is wrong for these four years. Seattle wins on frequency and edges it on volume. Spread over every calendar day, Seattle averages 3.03 mm and New York 2.86 mm, close enough that frequency and intensity nearly cancel.
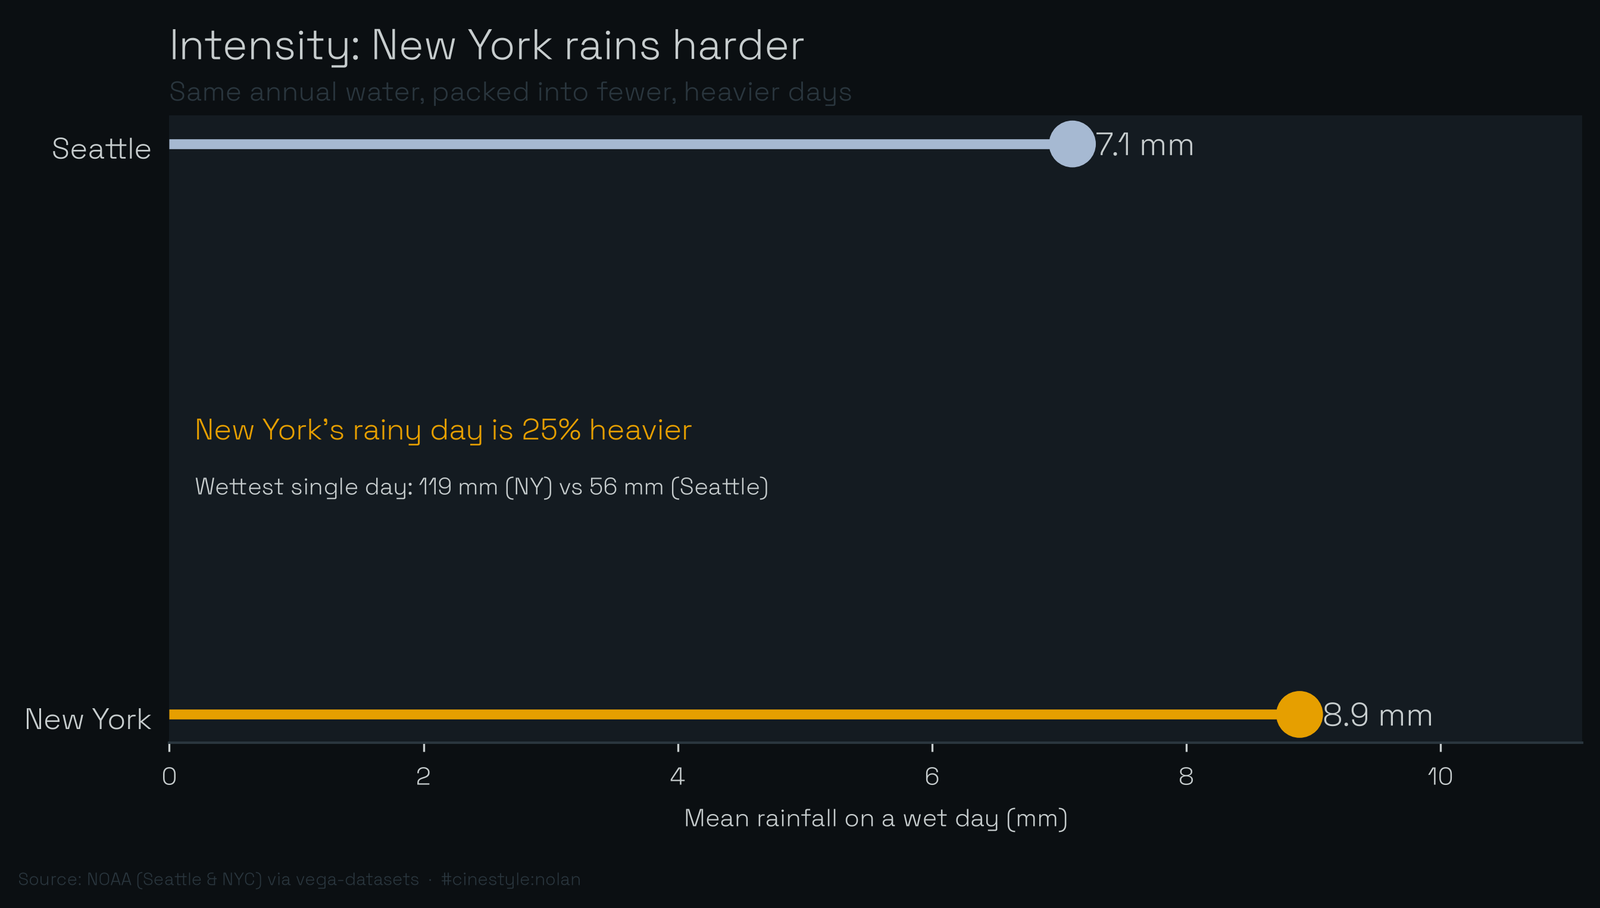
The intensity half survives, and it is the half worth keeping. Split each city’s total by its number of wet days and you get the average depth of a rainy day:
- Seattle: 7.1 mm per wet day
- New York: 8.9 mm per wet day
New York’s typical rainy day drops about 25% more water than Seattle’s, a ratio of 1.25. Seattle spreads a similar annual total across many gentle days. New York packs comparable volume into fewer, heavier ones. The median wet day is identical, 3.8 mm in both cities, so the typical rainy day feels the same in each place. The gap lives in the tail. New York’s wettest day in the record dumped 118.9 mm. Seattle’s wettest topped out at 55.9 mm, less than half. That one day nudges New York’s average, but take it out and New York still averages well above Seattle’s 7.1 mm per wet day. The heavier-rain gap does not rest on one storm.
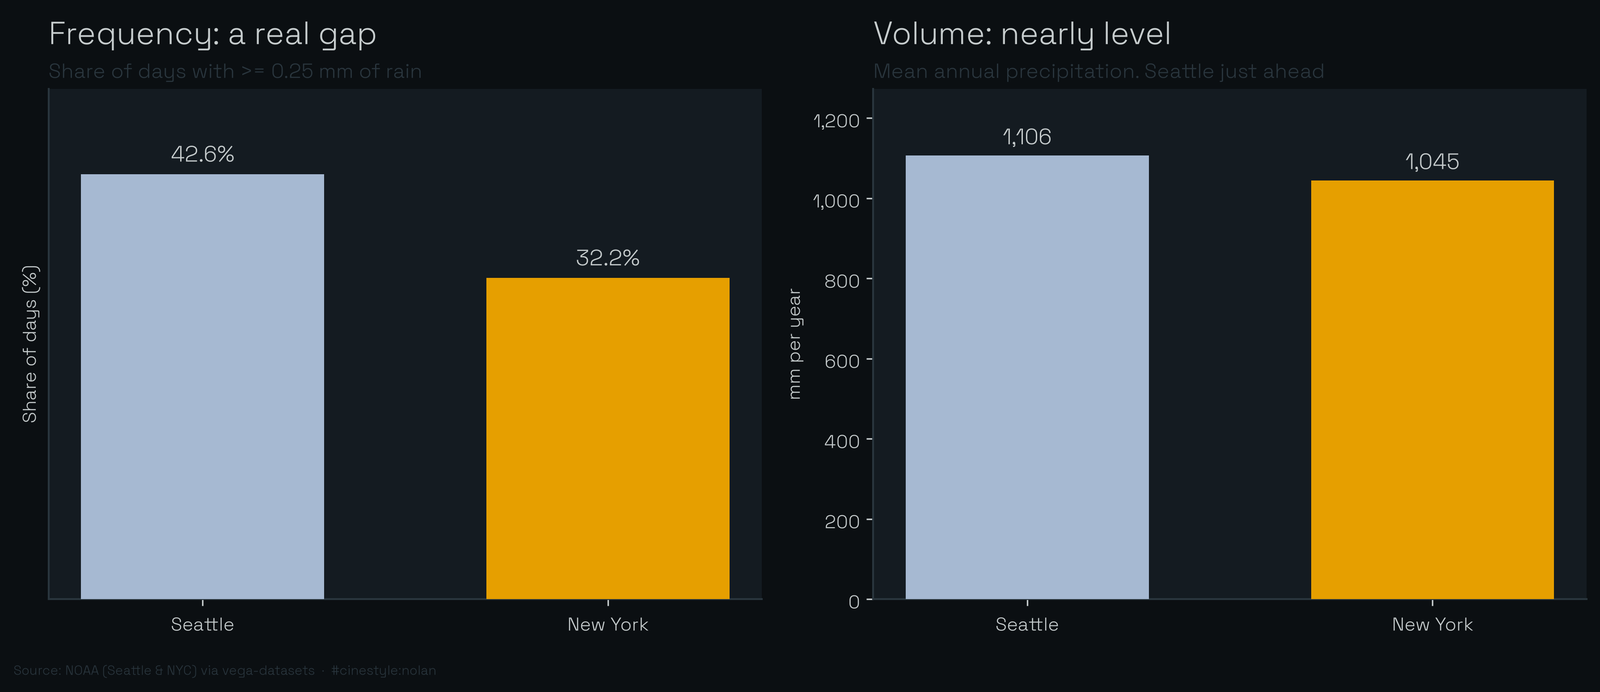
The dual bars make the split plain. Share of wet days, on the left, shows real daylight between the cities. Annual millimeters, on the right, sits nearly level, with Seattle just ahead. The frequency gap is large. The volume gap is small, about 6%, and it favors Seattle. Plot only the right panel and you would call these the same rainfall city, which is exactly the trap the reputation sets.
The temperature is the cleaner contrast
Precipitation turned out muddier than expected. Temperature gave me the crisp separation I was looking for. New York is a continental climate pretending to be coastal. Seattle is genuinely maritime, and the daily numbers show it.
Seattle’s mean winter low (Dec to Feb) sits at 3.3 C, above freezing. New York’s is -1.3 C, below it. In summer (Jun to Aug) New York’s mean daily high reaches 28.0 C against Seattle’s 24.9 C. New York is colder in winter and hotter in summer. That is what an ocean does, or fails to do: water hoards heat and releases it slowly, so a coastal city’s thermometer barely moves while an inland one swings. I measured each city’s seasonal spread as summer mean high minus winter mean low. Seattle came to 21.5 C, New York to 29.3 C. New York’s year stretches almost 8 C wider.
The extremes push the same direction harder, and so do the labels: New York’s days are tagged snow 6.4% of the time, Seattle’s 1.8%. New York’s coldest recorded low was -16.0 C. Seattle’s was -7.1 C. New York’s hottest high hit 37.8 C. Seattle’s hit 35.6 C. Both ends of New York’s thermometer reach further from the middle.
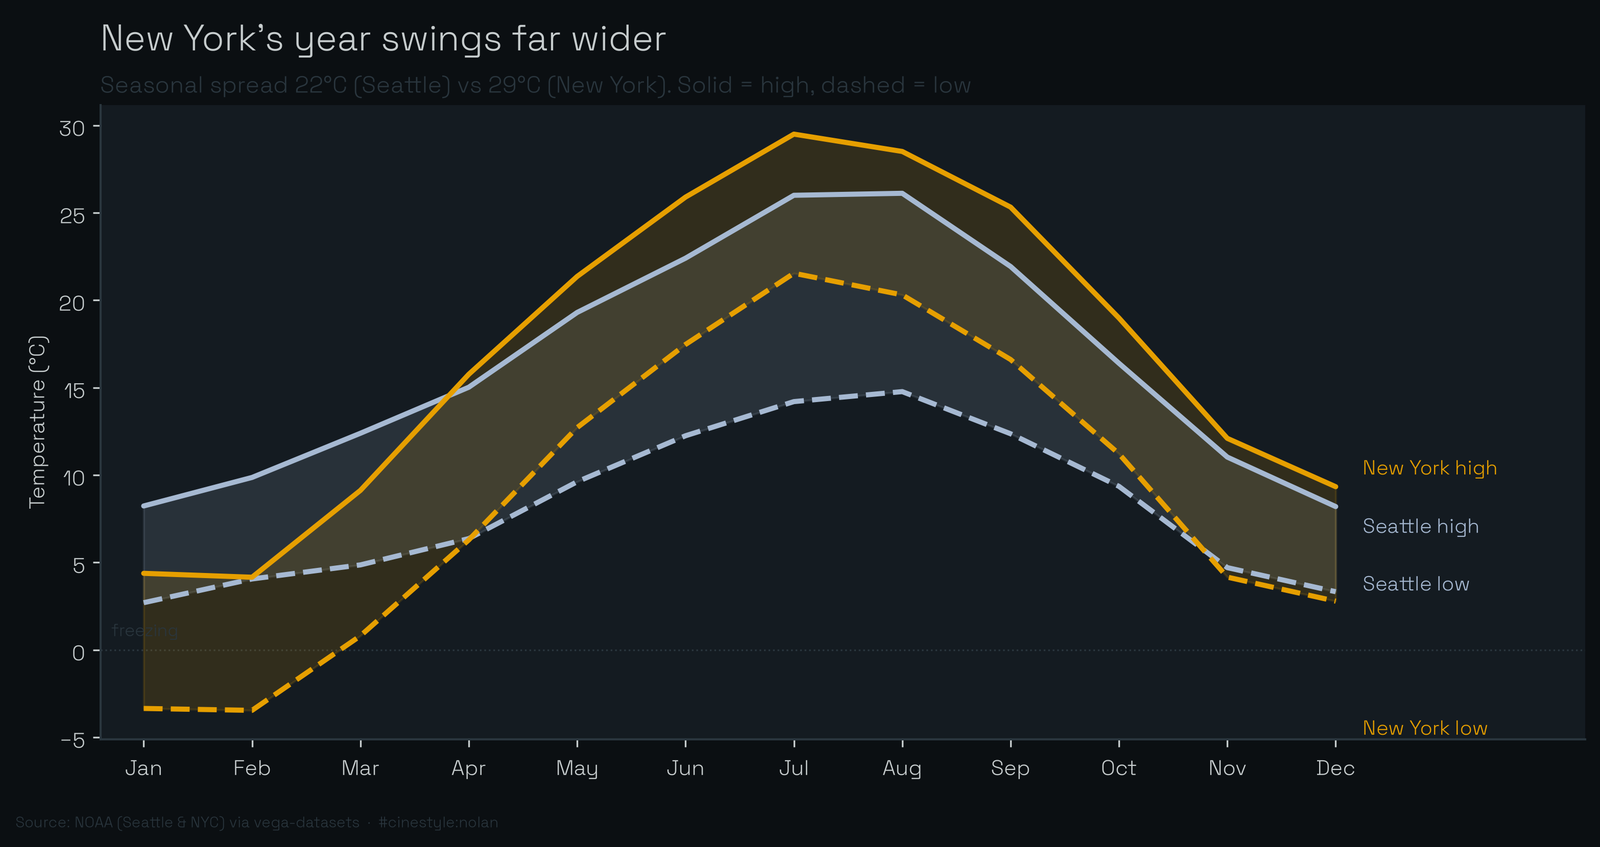
The summer highs never converge, and the gap between the winter lows is larger still, so the maritime-versus-continental difference is bigger in winter than in summer. The shaded bands, daily high to daily low, tell a different story at the day scale. Across the whole year the two cities have nearly the same average daily swing: New York’s mean high and low are 17.1 C and 9.0 C, Seattle’s 16.4 C and 8.2 C. In the chart, Seattle’s band is the wider one in summer and New York’s in winter. The ocean steadies Seattle across the seasons, not across the day.
Limits
This is four years and one weather station per city. A single station does not capture a metro area, and four years is short enough that one wet autumn can tilt a total. That is plausibly why Seattle out-totals New York here, when NOAA’s long-run climate normals put New York ahead on annual total. The weather labels (rain, drizzle, fog) are the dataset’s own coarse buckets, not a boundary I would stake a precise drizzle-versus-rain claim on. Read the volume numbers as what these four years did, not as what the climate is.
What I would stand behind: the frequency gap is large at the 0.25 mm threshold, and the dataset’s own labels agree (rain 43.9% against 30.5%). New York’s rain genuinely arrives in heavier bursts, a wettest day more than twice Seattle’s. Seattle’s reputation is built on the calendar, not the rain gauge. It rains there on more than four days in ten, and rarely much at once. New York skips most days, then occasionally throws 119 millimeters at you in one go.