// article
Who Owns the Economy
Five countries own half the world economy
In 2022 the world produced about 99.9 trillion dollars of output. The United States made a quarter of it, 25.7 trillion, from a single country with about 4 percent of the people. Add China, Japan, Germany, and India and you have passed half. The other 197 economies in the data split what is left.
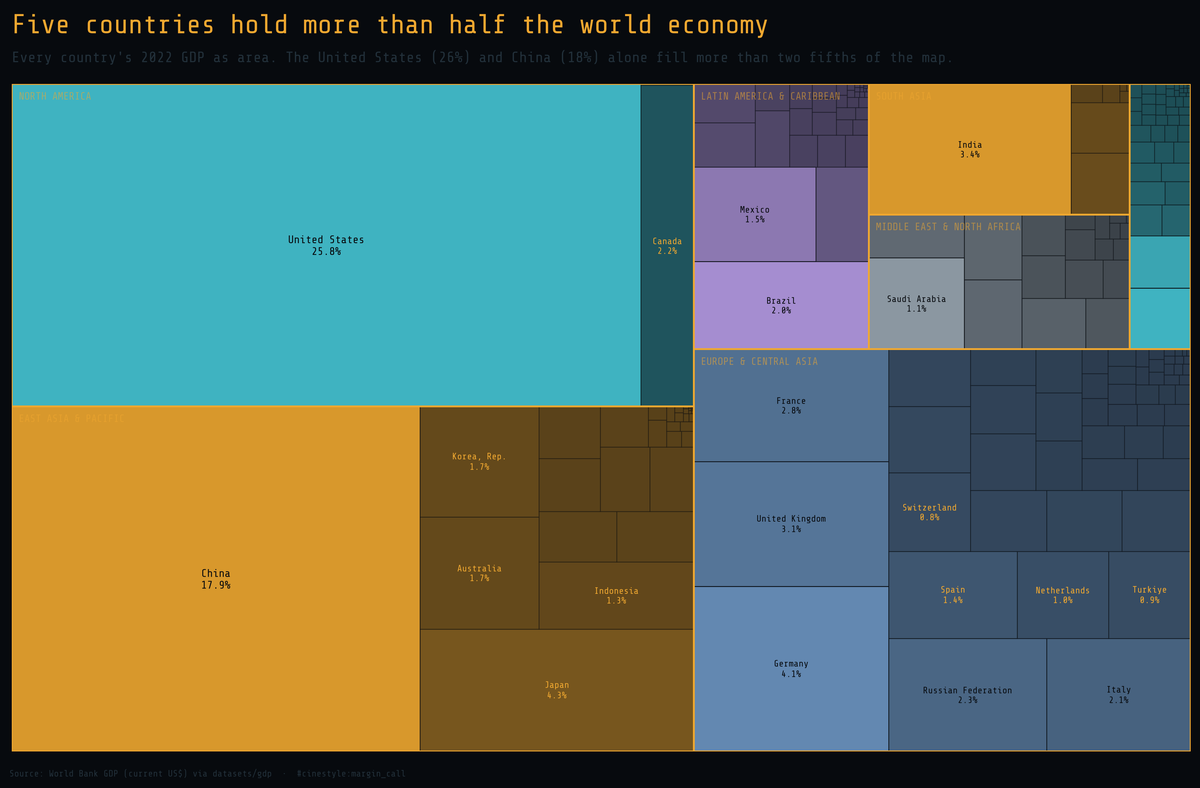
Every rectangle above is one country, sized by its true GDP, grouped into its World Bank region. No axis to truncate, no scale to bend. Area is the value. The United States is the slab at the upper left, China the slab below it, and between them they cover more than two fifths of the whole map. That single picture is the article. The rest is me checking that it holds up.
The data, and what I threw out
The source is the World Bank’s GDP series in current US dollars, pulled from the datasets/gdp mirror. Four columns: country name, ISO code, year, value. The catch is that the file mixes real countries with World Bank aggregates. “World”, “Euro area”, “High income”, “Sub-Saharan Africa”, and 44 other roll-up rows sit in the same column as France and Fiji. Sum the column blind and you triple-count the planet.
So the first job is subtraction. I dropped 48 aggregate codes by their ISO codes, every region, income band, and lending category. What remains is 202 sovereign economies for 2022, the latest year where more than 200 countries report. Those 202 sum to 99.9 trillion dollars, and that is the denominator for every share below.
I assigned each country a region from Natural Earth’s World Bank region field, with a hand map for the 41 small island states and microstates that do not key cleanly. Zero ended up unclassified. A treemap that silently bins half the Pacific into “Other” is worse than no treemap.
How lopsided is it
Rank the 202 countries and walk down the list:
- Top 1 country: 25.8% of world GDP
- Top 5 countries: 55.4%
- Top 10 countries: 67.7%
Ten countries out of two hundred hold two thirds of global output. The Gini coefficient of the distribution is 0.88. Income inequality inside even a sharply unequal country sits well below that. GDP across countries is more concentrated than income is inside almost any one of them.
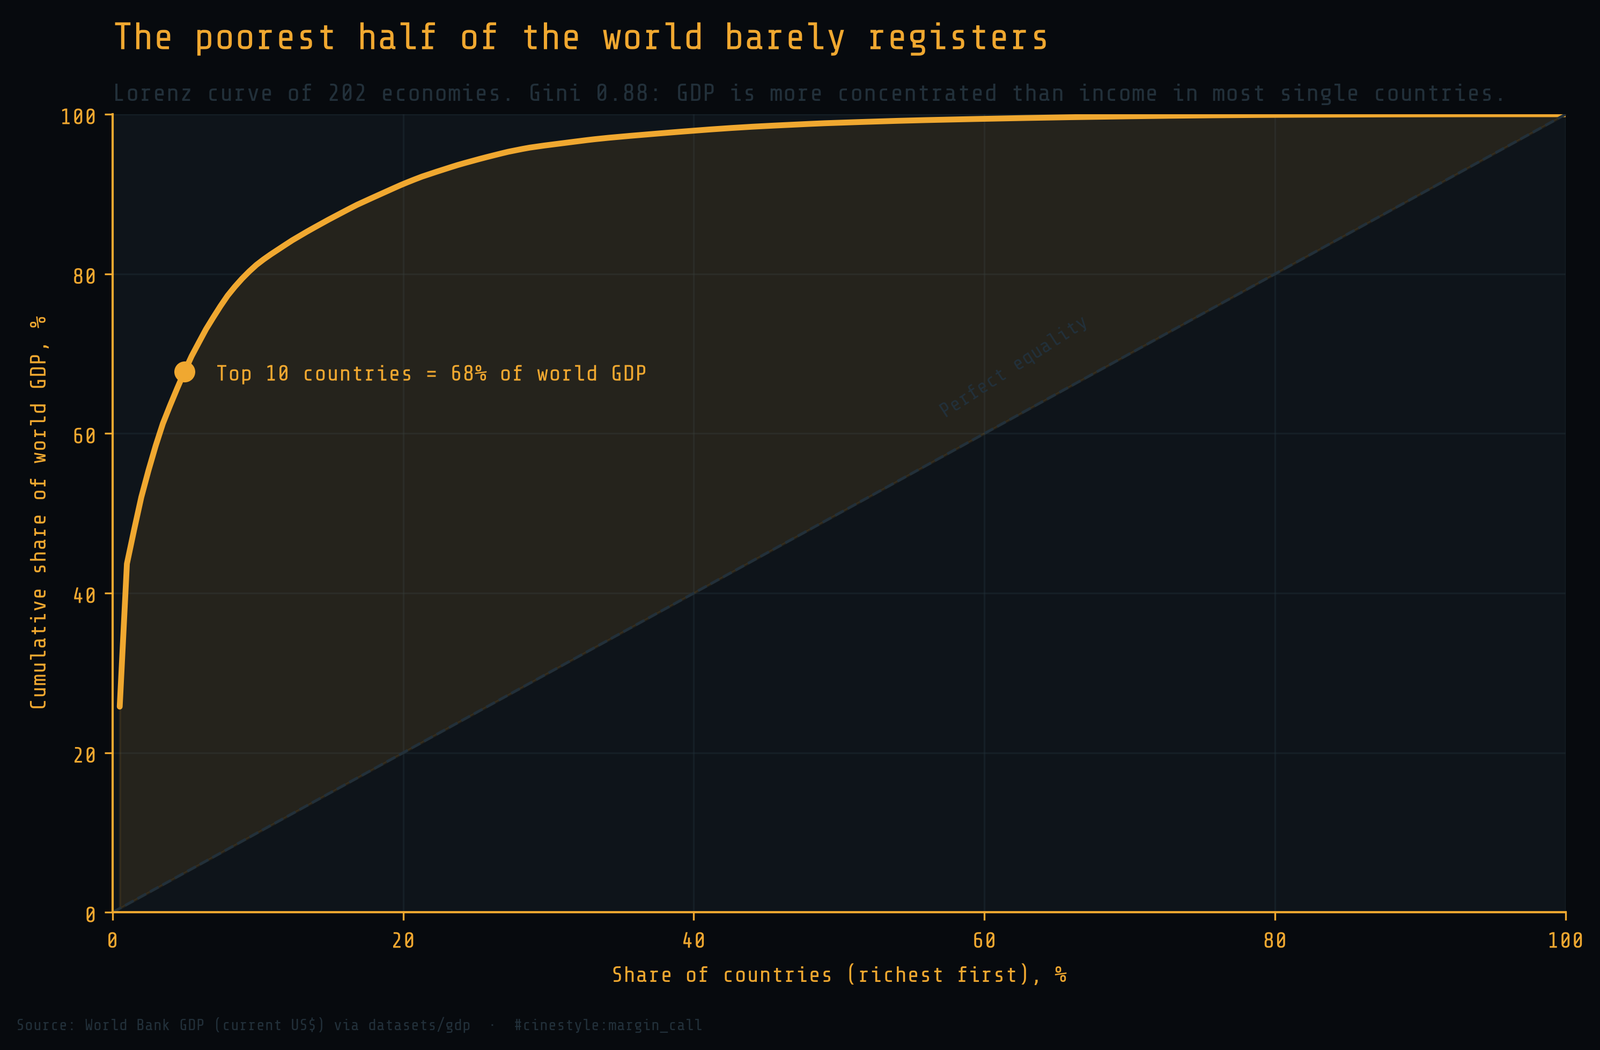
The Lorenz curve makes the shape literal. The dashed diagonal is the world where every country produces the same. The real curve hugs the floor, then snaps up at the right edge where the giants live. The median country holds 0.03% of world output. The entire bottom half of countries, 101 economies, combine for 1.06%. It takes the 189 smallest economies stacked together to equal the single largest. That is not a long tail. It is a cliff with a few towers next to it.
The US and China, measured
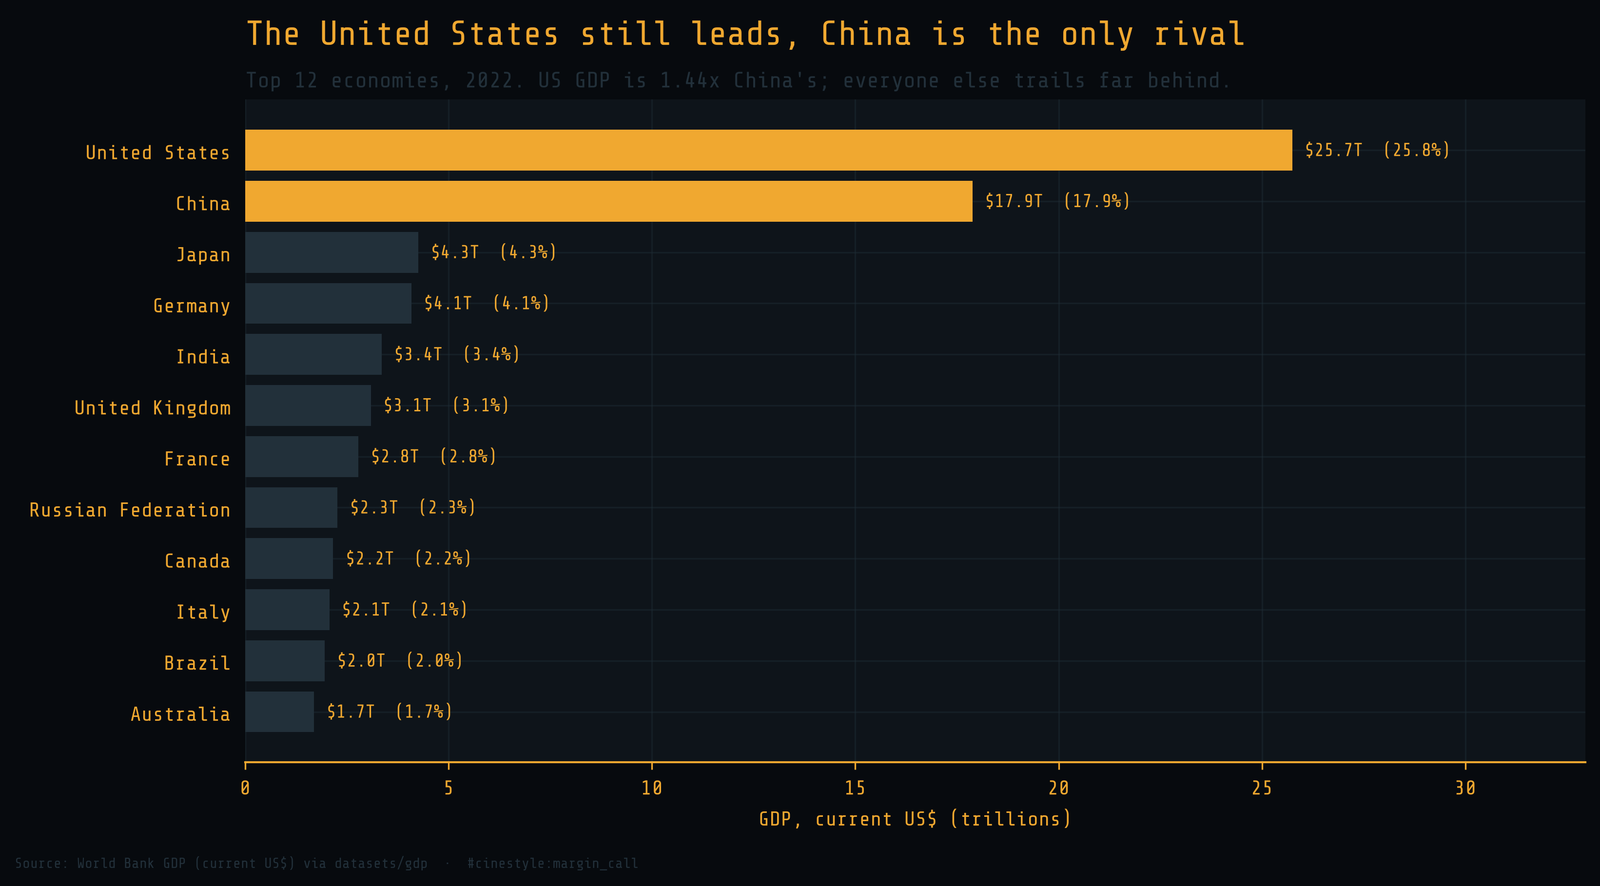
The headline rivalry is real but narrower than the noise around it suggests. US GDP in 2022 was 25.74 trillion. China’s was 17.88 trillion. The US figure is 1.44 times China’s, a gap of about 7.86 trillion dollars, larger than the entire economy of any country outside the top three.
Two cautions, because current-dollar GDP is a specific lens. It values everything at market exchange rates, so a strong dollar widens the gap on paper. Measured at purchasing power parity, China already produces more than the US, and this dataset does not carry the PPP series. And 2022 was a strong-dollar year. The 1.44x is a true number, but it is a snapshot of one accounting choice in one year, not a verdict on which economy is larger by every measure.
What does not move under any lens is the distance to third place. Japan, the next economy down, produced 4.3% of world GDP. The US and China together produced 43.7%. The contest at the top is between two countries; everyone else is in a different bracket.
Geography did most of the sorting
Group the 202 countries by region and the world splits into three heavyweight blocs and a long shadow.
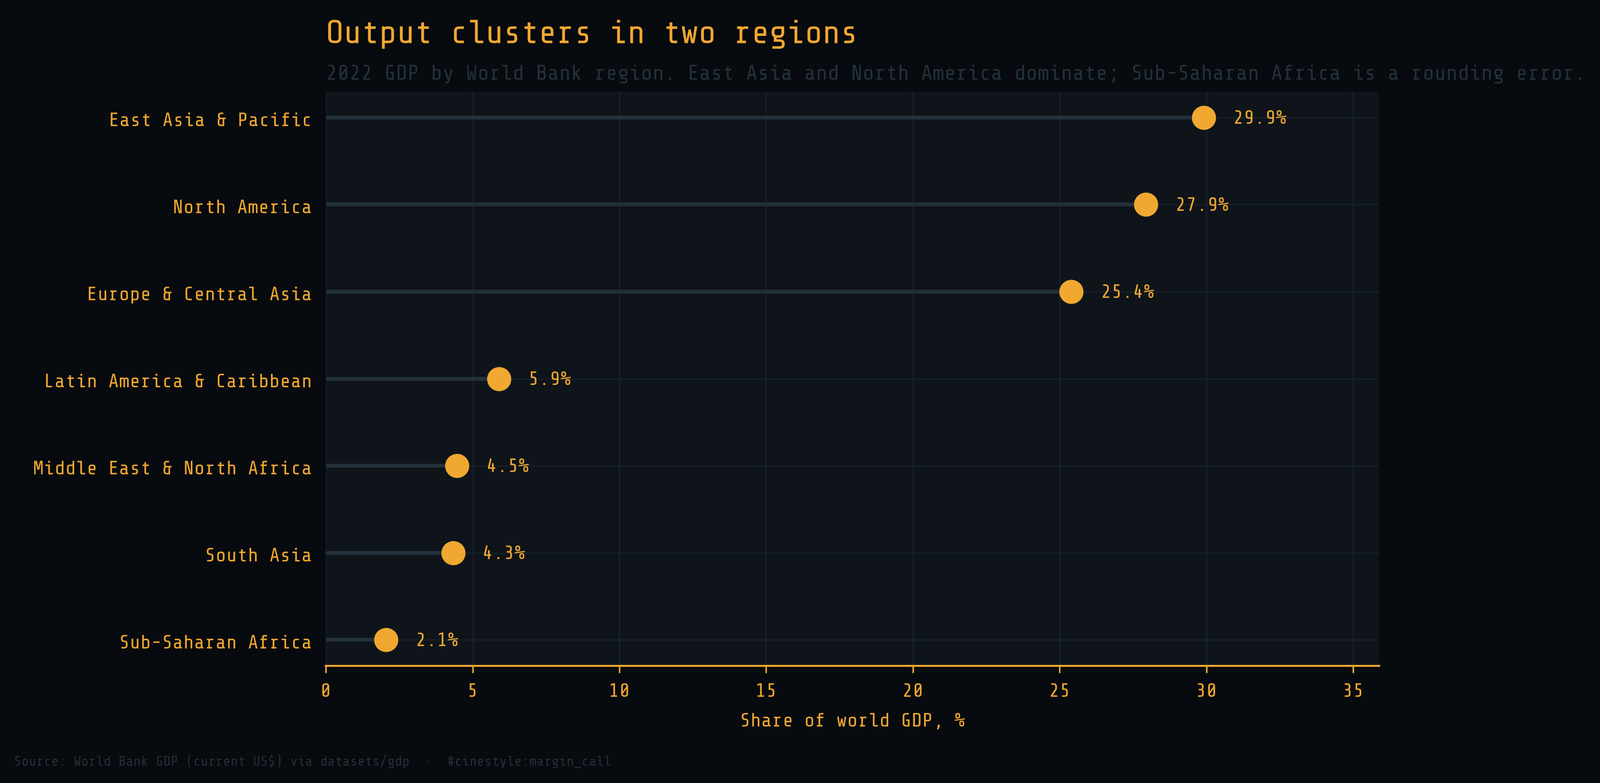
East Asia and Pacific leads at 29.9%, North America follows at 27.9%, Europe and Central Asia at 25.4%. Those three hold 83.2% of world output between them. Then the drop. Latin America and the Caribbean is 5.9%, the Middle East and North Africa 4.5%, South Asia 4.3%. Sub-Saharan Africa, 48 countries and more than a billion people, produces 2.05% of the world’s GDP. Its entire regional output is smaller than the gap between the US and China.
There is a subtlety the regions hide. East Asia leads the table, but the bloc is really one country: China alone is 17.9% of the world, more than half its own region. North America is the US plus a Canadian sliver. Even the regional story is a story about a handful of countries.
What the map gets right and where it strains
The treemap honors the data, which is the whole point of using area instead of a truncated bar. But area has a cost. The smallest economies are real and the chart cannot show them. Tuvalu and Nauru exist in these 202 rows; on a map where the US is a quarter of the canvas, their rectangles are slivers thinner than the border lines, and they carry no label. The chart is honest about magnitude and silent about the floor. That is the right trade for this question. If you wanted to study the poorest economies, you would throw this chart out and start over with a log scale, which lies about area on purpose to let small things be seen.
I went in expecting concentration and found more of it than I budgeted for. The surprise was not the US-China gap, which is in every headline. It was the bottom half: a hundred and one countries adding up to one percent of the world. The world economy is not a distribution with a heavy tail. It is five countries and a rounding error.