// article
What Makes Wine Good
Wine quality is mostly just alcohol, and even that only gets you so far
You can predict a red wine’s tasting score from its chemistry, but not well, and the reason is baked into the label. The score is a committee’s median opinion rounded to a whole number, and no chemistry panel recovers more than about 42 percent of it. The single strongest feature is alcohol, and it carries half of even that.
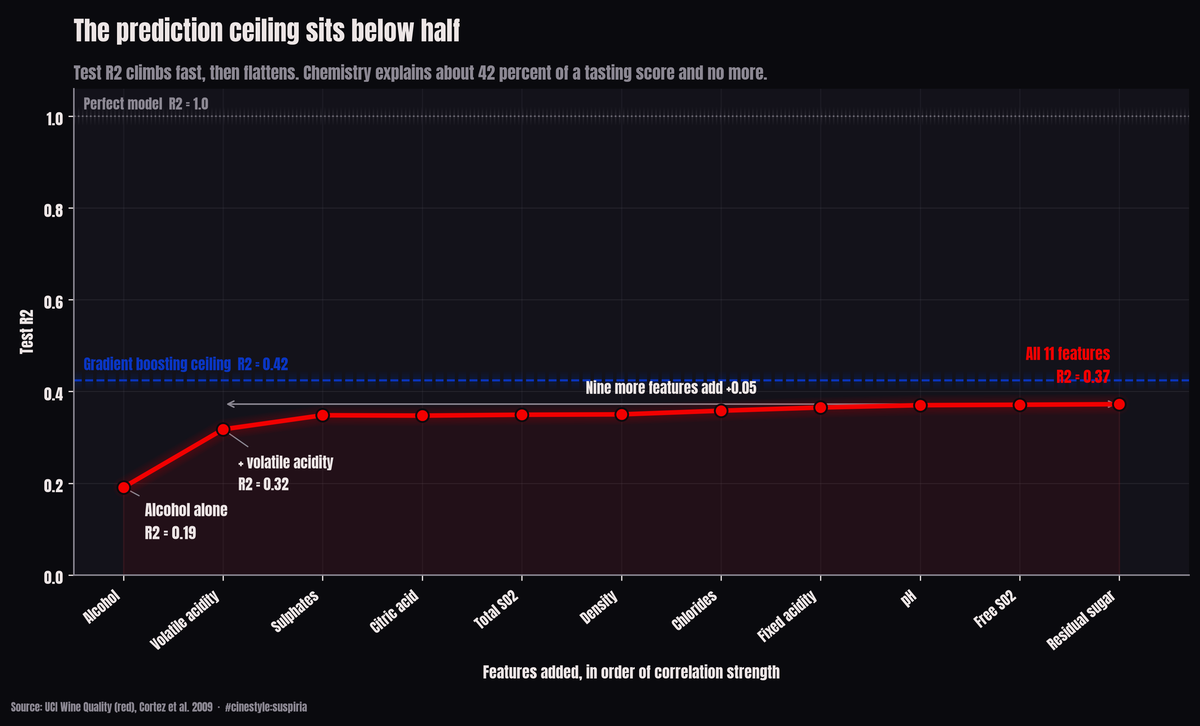
The chart above is the whole story in one frame. Add features in order of how strongly they correlate with quality and the test R2 climbs steeply for the first two, then runs into a wall. Alcohol gets you to 0.19. Volatile acidity takes it to 0.32. The other nine features, combined, add about 0.05. Past that point you are polishing noise.
The data
This is the UCI Wine Quality red set (Cortez et al. 2009, pulled via plotly/datasets). 1,599 rows, 11 features, one target: quality, an integer from 3 to 8 that is the median of at least three blind sensory ratings from wine experts. So the label is not a measurement. It is a committee’s median opinion, rounded to a whole number. Hold that thought, because it caps everything that follows.
The first thing I check is the target distribution, and here it is lopsided. The quality scores are not spread evenly across 3 through 8. 1,319 of the 1,599 wines (82.5 percent) score a 5 or a 6. The mean lands at 5.636. The extremes are nearly empty: ten wines rated a 3, eighteen rated an 8. So most of the prediction problem is really “is this a 5 or a 6,” and the interesting wines, the ones you would actually want to flag, barely exist in the data.
Ranking the features
I ran a straight Pearson correlation of each feature against quality and sorted by magnitude. Alcohol tops it at +0.476. Volatile acidity, the vinegar smell that ruins a wine, comes second at -0.391, which is the sign you would hope for: more spoilage acid, lower score. After those two there is a steep drop. Sulphates sit at +0.251, citric acid at +0.226, and everything below that is noise-adjacent. Residual sugar correlates at +0.014, which is to say not at all. pH manages -0.058.
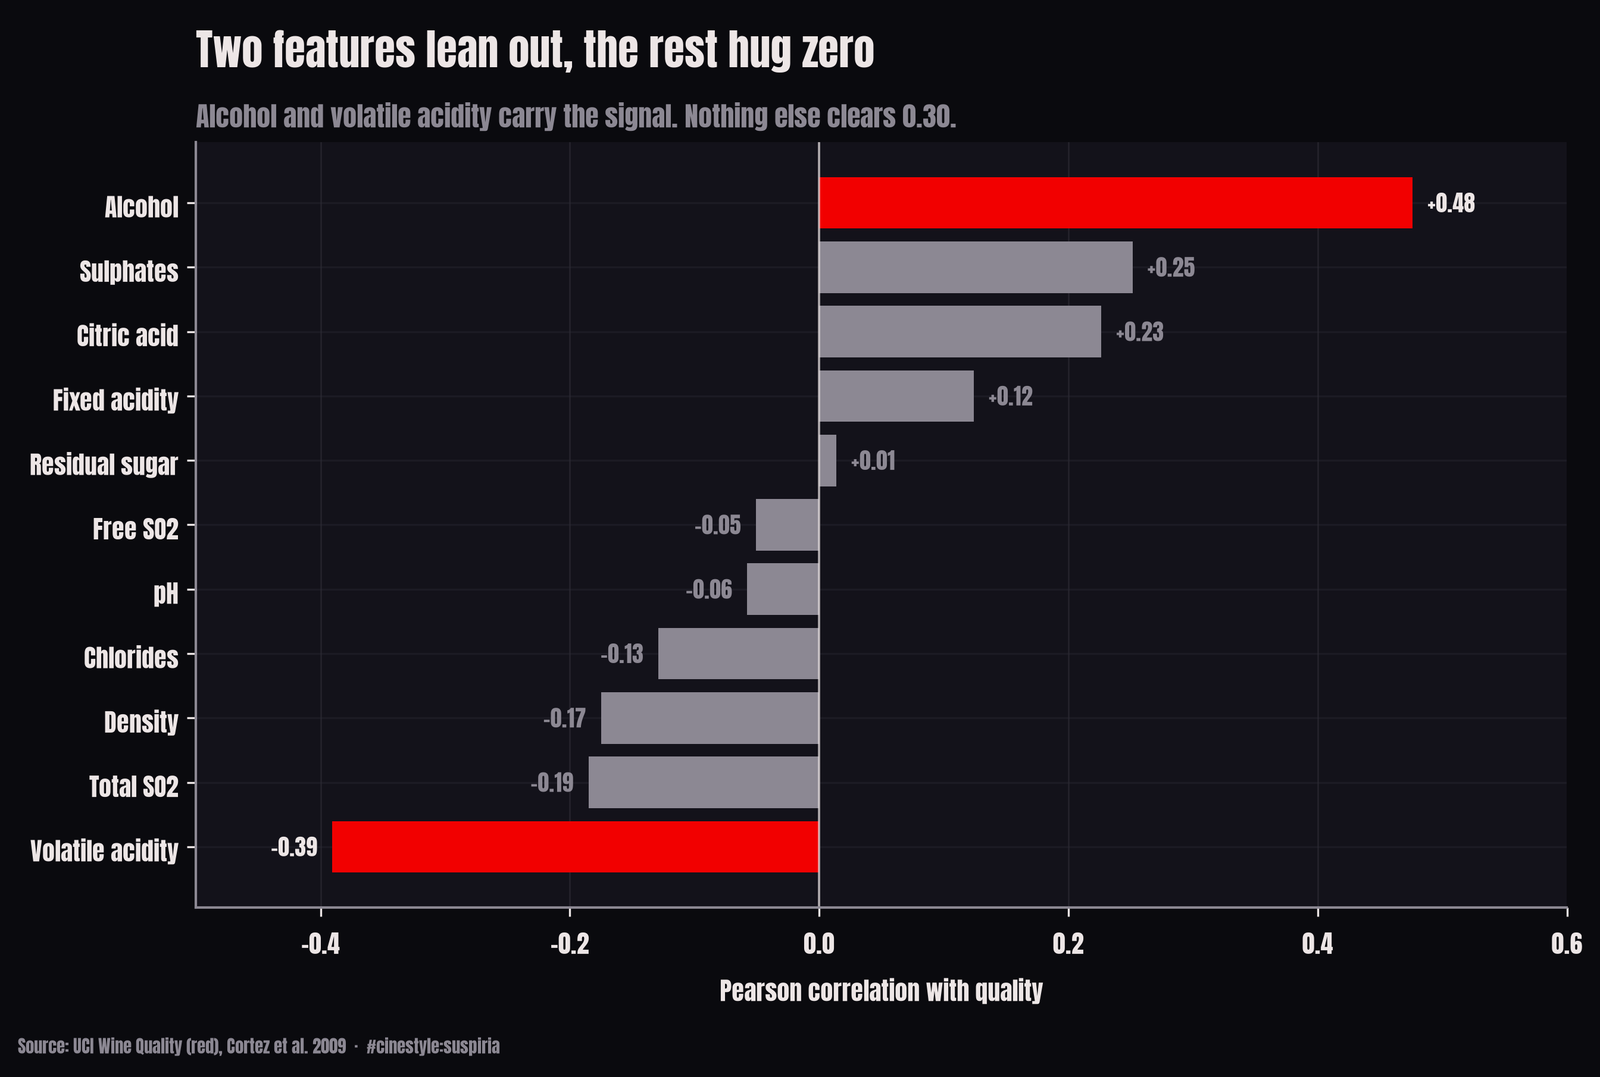
The bar chart makes the cliff obvious. Two features lean out hard, a couple more nudge, and the bottom half of the list hugs zero. What is a little odd is how weak pH and residual sugar are. I had assumed sweetness and acidity balance would drive a tasting score. The graders did not reward it, at least not in any way that survives a linear correlation.
How well can you actually predict it?
I split the data 75/25 (1,199 train, 400 test, seed 42), scaled inside a Pipeline so nothing leaks from test into the scaler, and fit two regressors. Every number below is test-set only.
Plain linear regression on all eleven features gets an R2 of 0.372 with an RMSE of 0.623. Gradient boosting does a bit better: R2 0.424, RMSE 0.597. For reference, predicting the training mean for every wine gives an RMSE of 0.787, so both models beat the dumb baseline, but not by a landslide. The error drops from 0.79 to about 0.60 of a quality point.
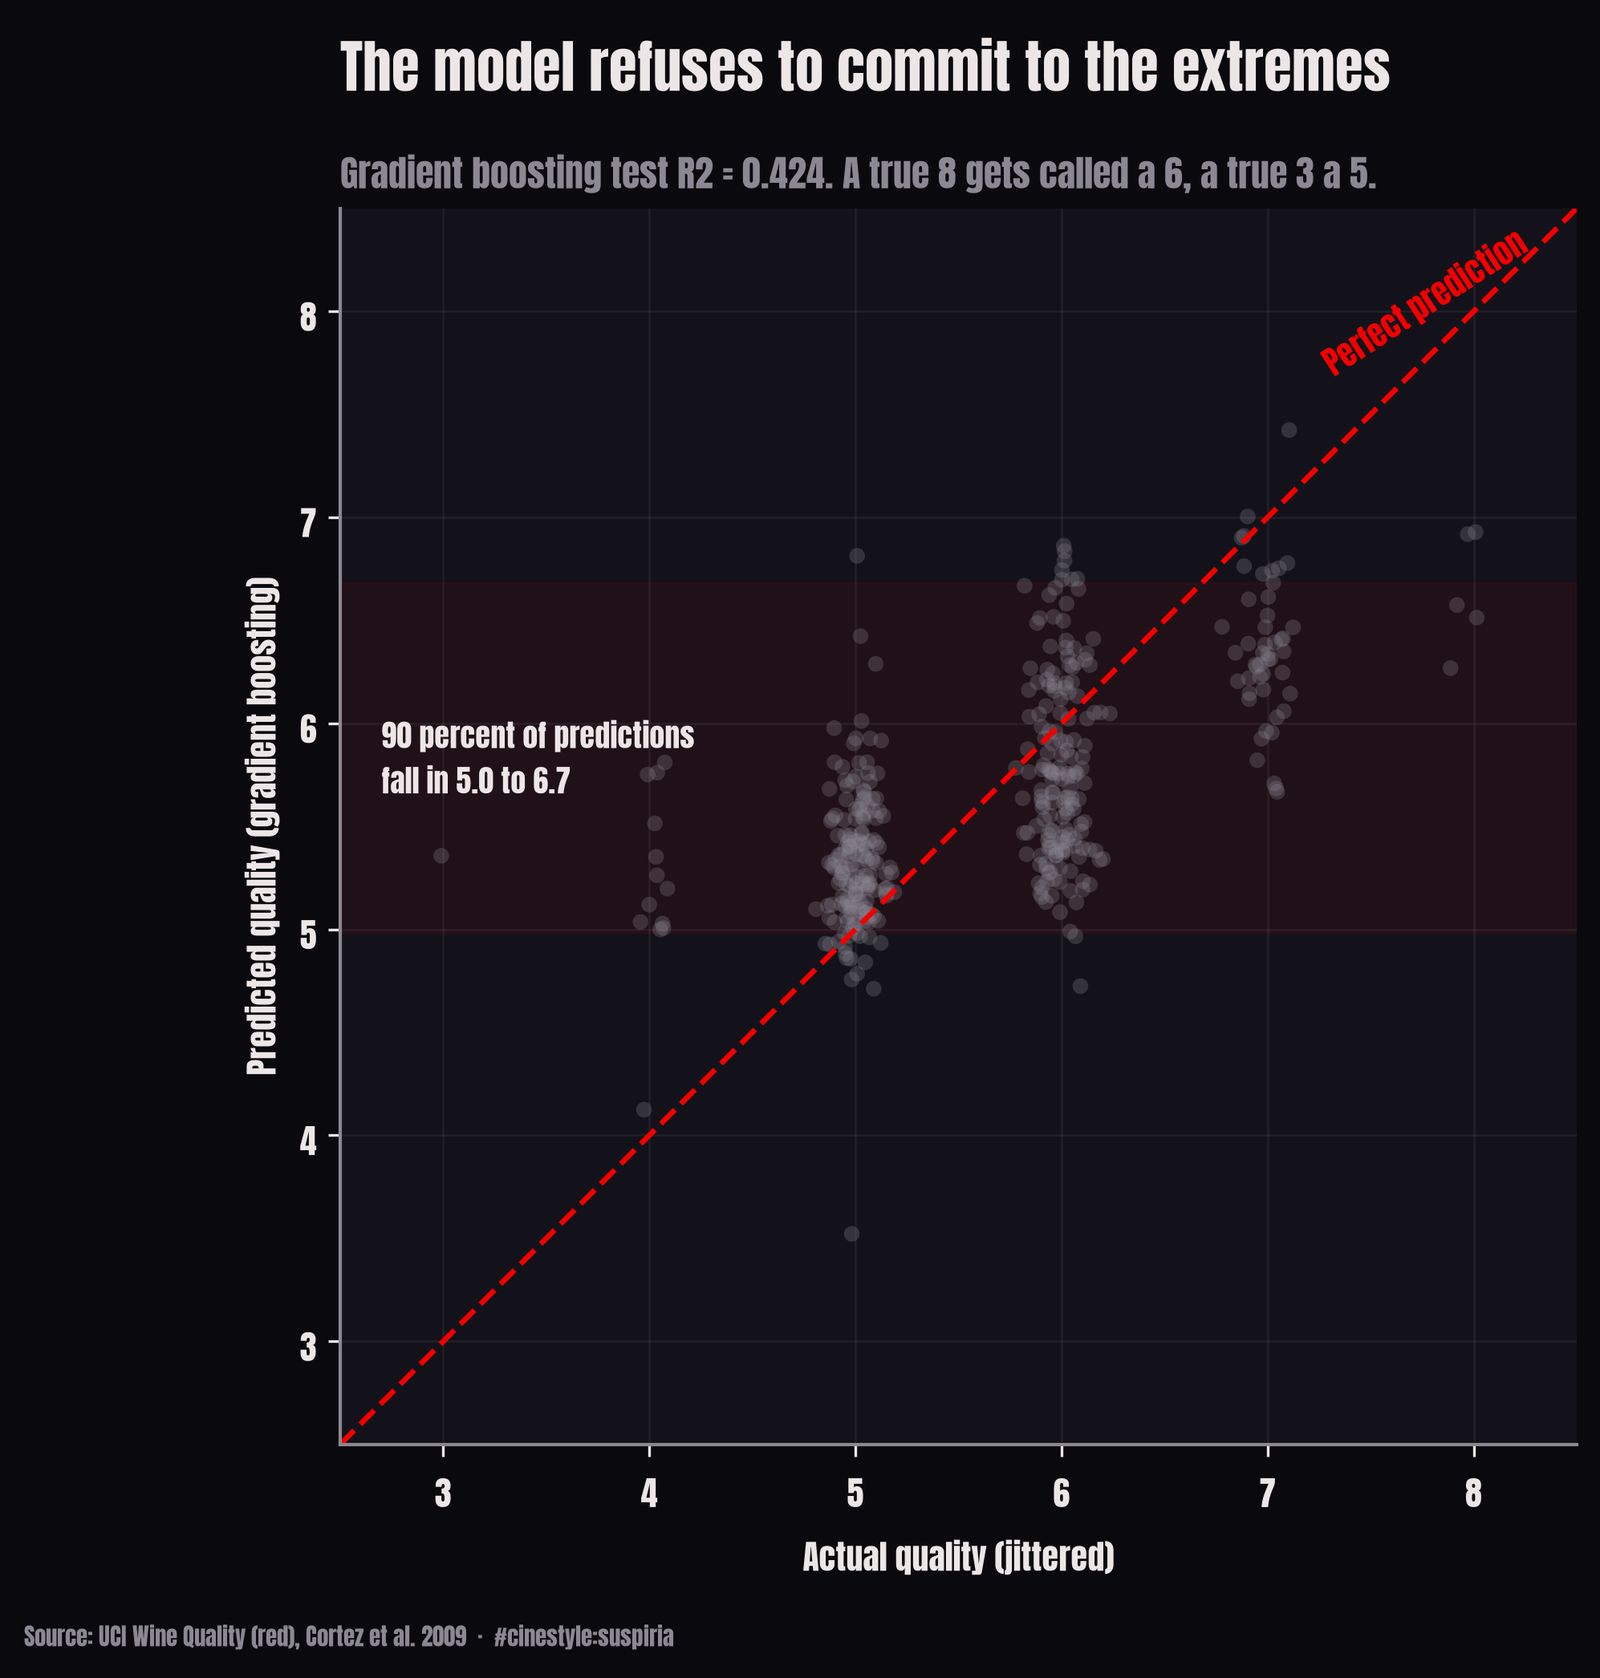
The predicted-versus-actual plot is where the ceiling shows itself. The model refuses to commit to the extremes. Ninety percent of its predictions fall between 5.0 and 6.7 no matter what the true score is. A wine actually rated 8 gets called a 6. A 3 gets called a 5. It is regressing hard to the middle, which is the rational thing to do when 82.5 percent of your training labels are 5s and 6s and the tails are nearly empty.
Now the part that made me re-run it. I refit linear regression on alcohol alone, dropping the other ten features. Test R2: 0.191. So one feature, by itself, recovers 51.3 percent of what the full eleven-feature linear model achieves. Half the predictive power of the entire chemistry panel sits in a single column. Gradient boosting agrees from the other direction: its top feature importance is alcohol at 0.387, more than double the next one (sulphates, 0.181).
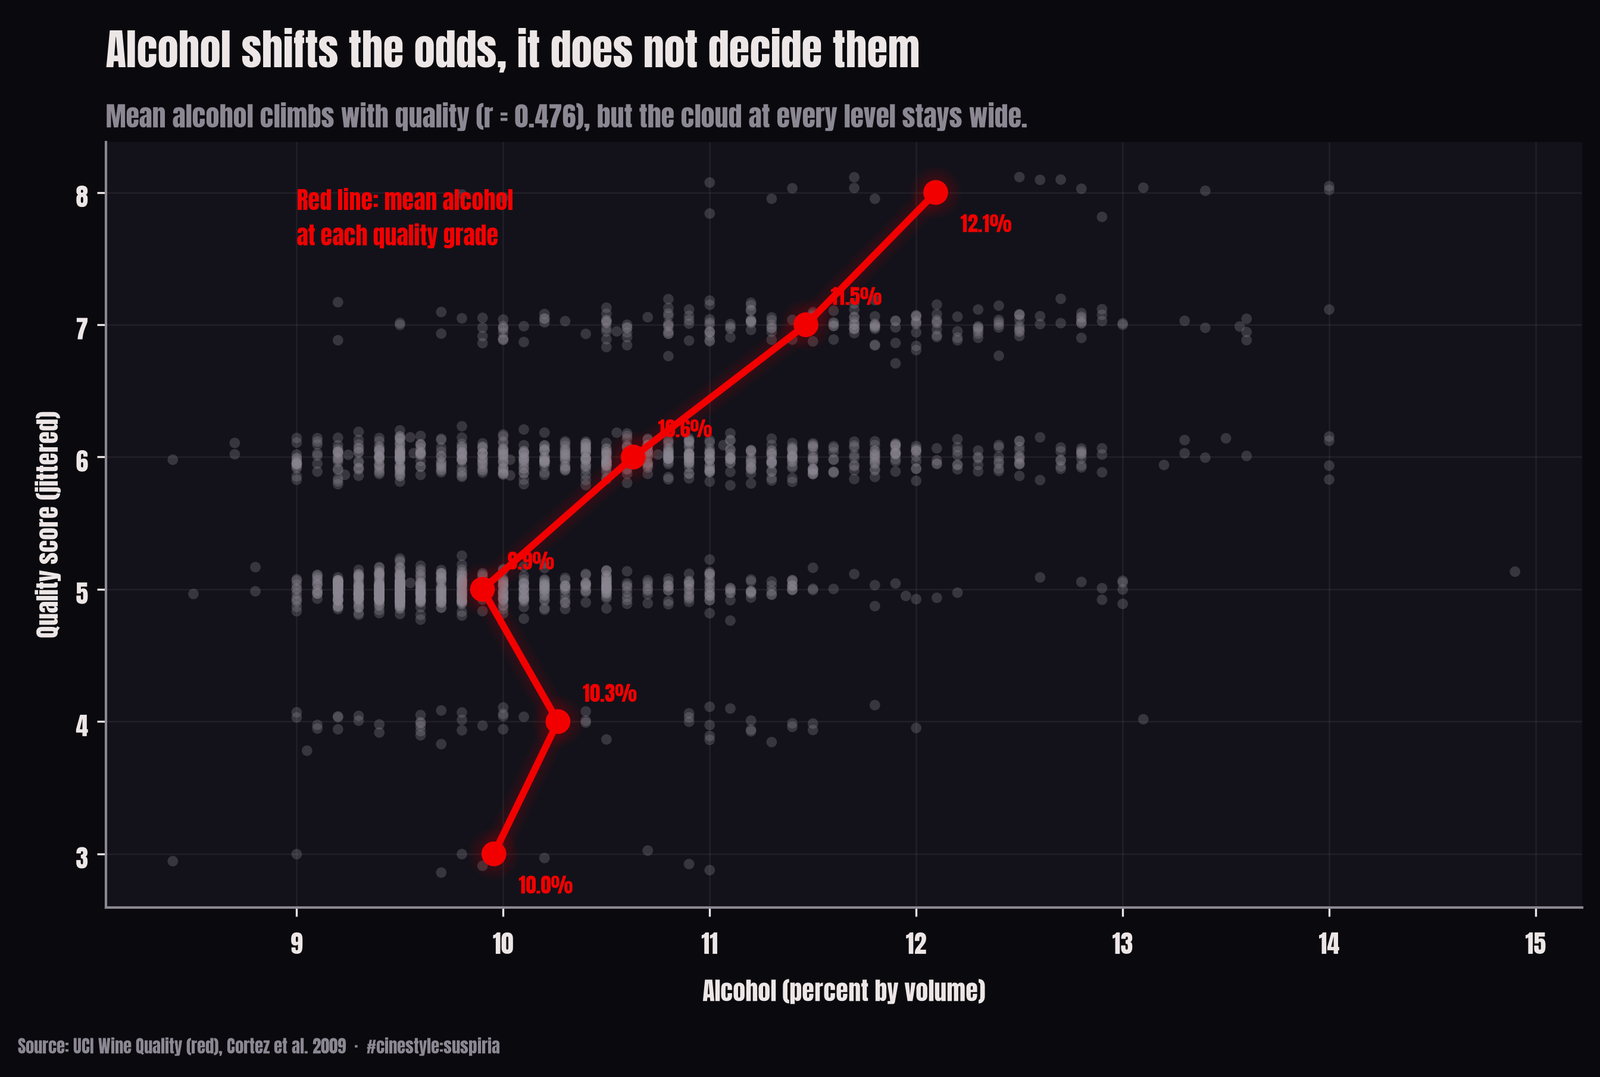
You can see the relationship and its limits in one figure. Mean alcohol climbs steadily with quality. The red line walks up and to the right. But the grey cloud is just that, a cloud. At any given alcohol level you will find wines scored 4 through 7. Alcohol shifts the odds. It does not decide the verdict.
Treating it as a classifier instead
Maybe regression is the wrong frame. What I would actually want in production is a flag: is this a good wine or not? So I binarized. quality >= 7 is “good,” everything else is not, and I trained a gradient boosting classifier with the same split, this time stratified.
The accuracy looks great. 90.7 percent. Then you check the baseline and the air goes out of it. Only 13.6 percent of wines are good, so a model that says “not good” to everything is already right 86.5 percent of the time. The four-point gain over that is real but small.
The honest number is recall on the good class: 0.519. Of the 54 genuinely good wines in the test set, the model catches 28 and misses 26. Precision when it does fire is 0.718, F1 is 0.602, ROC-AUC is 0.898. So it ranks wines reasonably, the AUC says the probabilities are informative, but at the default threshold it lets half the good bottles through. That is the class imbalance biting. With 217 good wines in the whole set, there is not much signal for “exceptional” to learn from.
What I would actually claim
You can predict red-wine quality from chemistry, but the ceiling is low, and it is low for a reason. The target is the median of subjective expert scores compressed onto a six-point integer scale, with 82.5 percent of the mass on two values. No amount of feature engineering fixes a label that is mostly a coin flip between 5 and 6. Gradient boosting tops out at R2 0.424, and alcohol alone already carries half of that.
One caveat I will not bury: this is one region’s red wines (vinho verde, Portugal), scored by one panel’s conventions. The alcohol effect might be a vinho-verde quirk, or it might be that more fermentation generally means riper, better fruit and tasters reward it everywhere. This dataset cannot tell me which. What it can tell me is that if you only get to measure one thing about a red before guessing its score, measure the alcohol.