// article
The Jobs That Vanished
Construction lost almost a third of its jobs, and never got them back
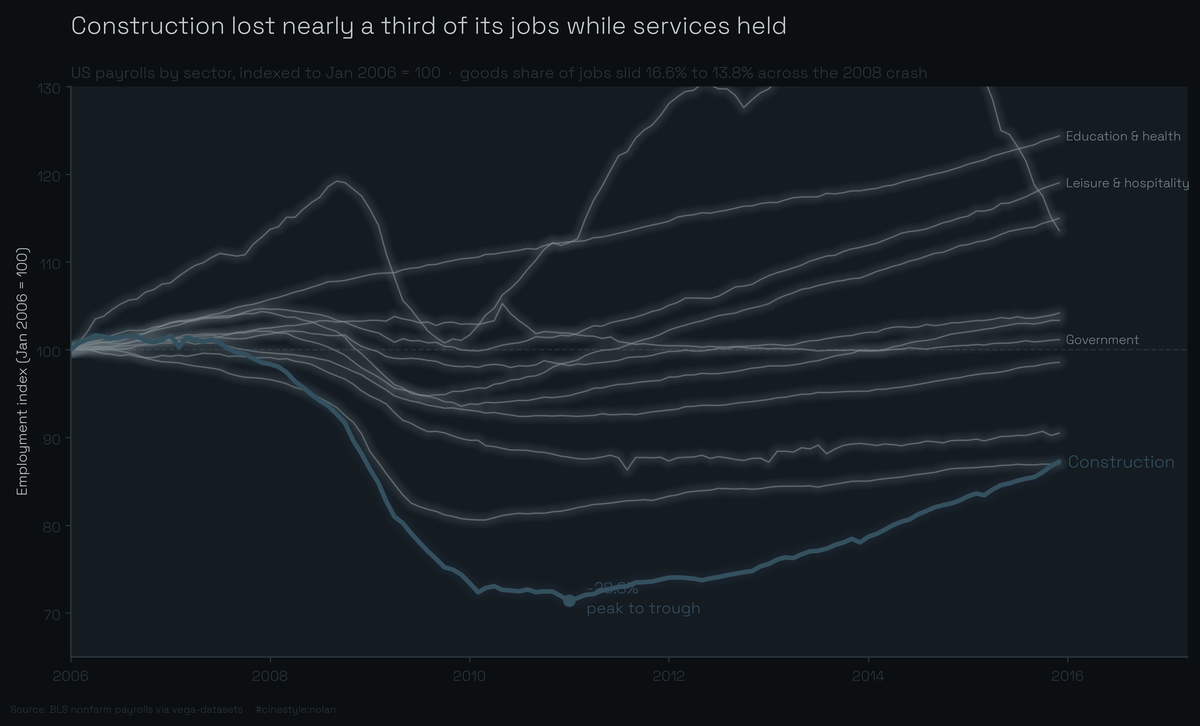
The 2008 recession did not hit every job the same way. Index every sector to its January 2006 level and the downturn stops being a single recession and turns into a sorting machine. One line drops out the bottom of the chart while the rest barely move. That line is construction, and it never makes it home.
Between its 2008 peak and the bottom in 2010, US construction shed 28.8% of its payroll. Not 28.8% of the losses. 28.8% of the entire sector, gone. Manufacturing dropped 19.5% over the same stretch. Education and health services did not have a single down month through the whole recession. That spread is the story of the 2008 crash in employment levels. It was not a recession that hit everyone. It fell almost entirely on the things people build with their hands.
I went looking at the BLS nonfarm payroll series (via vega-datasets): 120 monthly observations, January 2006 through December 2015, in thousands of jobs across 23 sector columns. I expected the usual goods-to-services drift you read about everywhere, and I got it. The more interesting thing was how lopsided the crash itself was, and how much of that lopsidedness never reversed.
The slow tilt
Start with the background trend, because it sets up everything else. Over the ten years, total nonfarm employment rose from 135.45 million to 143.09 million, a gain of 7.64 million jobs, or 5.64%. That headline number hides two opposite movements. Service-providing employment grew 9.18%. Goods-producing employment fell 12.15%. Picture two people on the same escalator, one walking up while the other walks down: the net reading is mild, the underlying motion is not.
You can see it cleanly when you index both lines to January 2006 = 100.
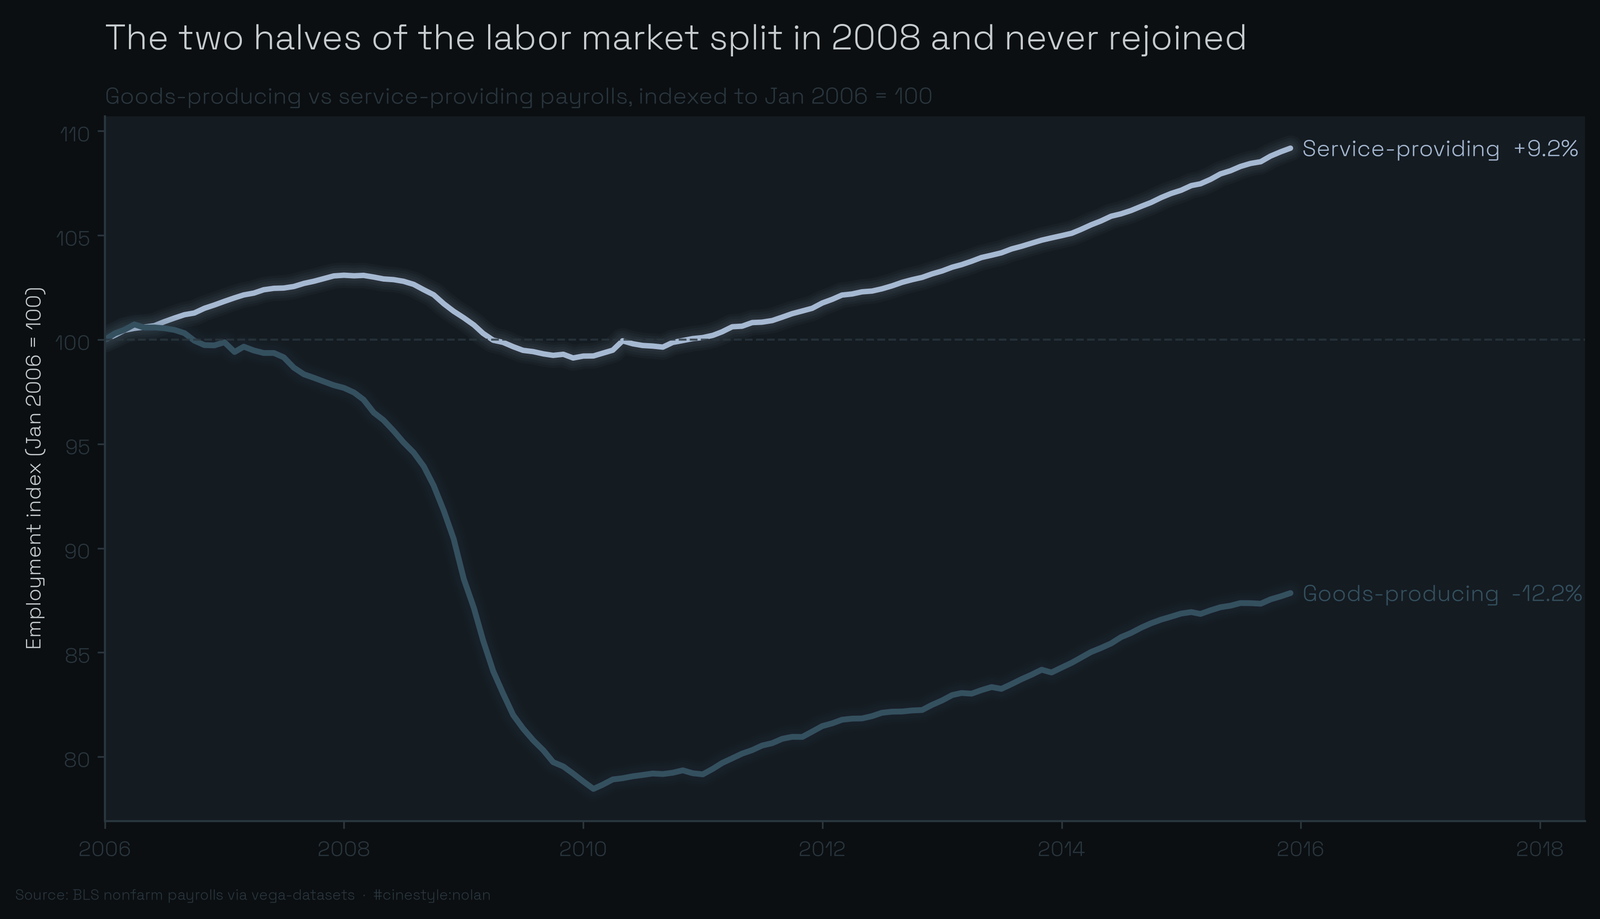
The two lines start together, peel apart in 2008, and never reconverge. Services dips in the recession and climbs back above its starting line by 2014. Goods-producing falls off a cliff and is still below where it started a decade later.
The share number makes it concrete. In January 2006, goods-producing work was 16.59% of all nonfarm jobs. By December 2015 it was 13.79%, a drop of 2.79 percentage points. The trough was lower still: goods-producing bottomed out at 13.58% of employment in May 2010, then clawed back a little but never near its old footing.
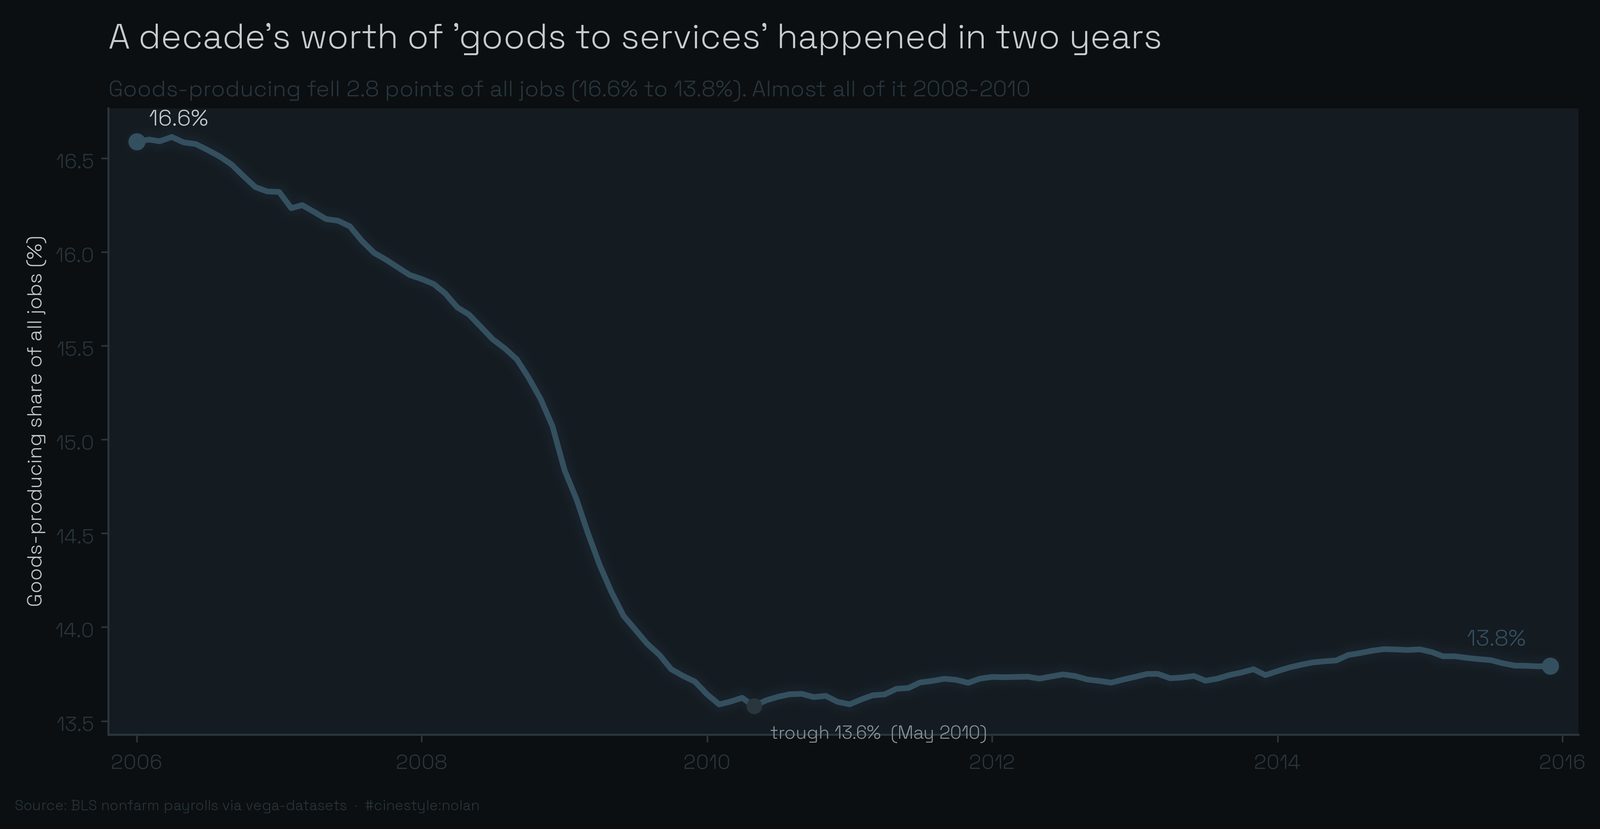
One thing about this chart is worth saying plainly. The decline is not a smooth secular drift. It is mostly a step. The share is roughly flat-to-gently-down through 2007, then it falls hard from 2008 to 2010, then it stabilizes. The long-run tilt from goods to services did not happen gradually here. It happened in about 24 months, courtesy of the crash.
The crash, sector by sector
Overall, nonfarm employment peaked in January 2008 at 138.42 million and bottomed in February 2010 at 129.73 million. That is 8.69 million jobs lost, a 6.28% drop. Brutal, but the average hides the variance.
I computed each sector’s own peak-to-trough decline across the recession window: its highest month before the bottom, down to its lowest month after. Ranked worst to least:
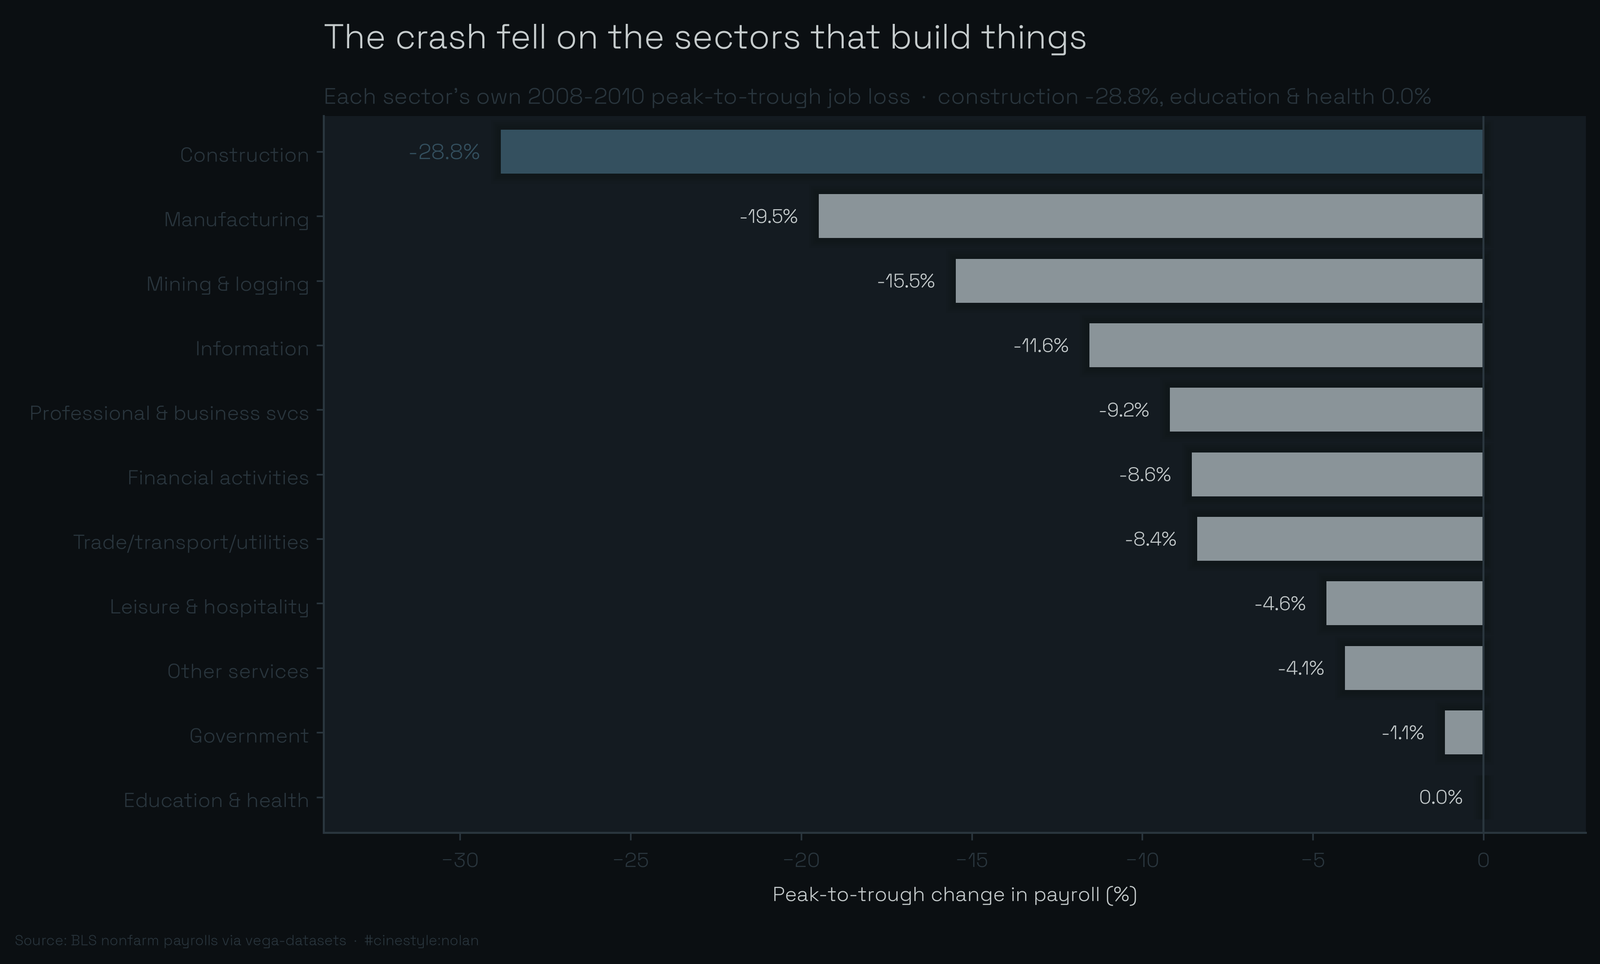
Construction: -28.81%. Manufacturing: -19.49%. Mining and logging: -15.47%. Information: -11.55%. Then it gets shallower: professional and business services at -9.19%, financial activities at -8.55%, trade/transport/utilities at -8.39%. Leisure and hospitality lost 4.60%. Other services, 4.06%. Government barely moved at -1.13%.
And education and health services: 0.00%. That is not a rounding artifact or a bug. I checked. The sector’s payroll was non-decreasing through the trough, so its highest month inside the window is the trough month itself, 19.84 million jobs in February 2010. It just kept growing, ending 2015 at 22.32 million, up 12.5% from that pre-crisis high. Hospitals and schools do not lay people off when housing collapses.
The damage concentrated on goods-producing work. Construction and manufacturing took the two worst hits by a wide margin, while the service sectors that were already growing took flesh wounds and kept going. A recession is not one weather system. It is a fault line, and it ran straight through the sectors that pour concrete.
What came back, and what did not
This is the part that turns a recession into a permanent reshaping. By December 2015, five and a half years past the trough, I checked which sectors had regained their pre-crisis peak.
Recovered, fully back above their old high: trade/transport/utilities, professional and business services, leisure and hospitality, other services, and education and health. Every one of them a service sector.
Not recovered by the end of 2015: construction, manufacturing, mining and logging, information, financial activities, and government. Construction was still 14.16% below its old peak after nearly six years of recovery. Manufacturing, still 13.12% short. These were not sectors having a slow quarter. They were structurally smaller than they had been, and the data runs out before they close the gap.
The lone surprise in that list is government, sitting 2.54% below its peak at series end. It only fell 1.13% during the recession proper, the smallest crash hit of any sector, but then kept bleeding afterward, through the austerity years, while the private side recovered. Its trajectory is the opposite shape from everyone else’s: a shallow, late, grinding decline rather than a sharp drop and a bounce.
The goods-to-services tilt people describe as a long-run trend mostly happened in two years and then stuck. The crash knocked construction and manufacturing down hard, services either dipped lightly or grew straight through, and when the dust settled the goods share of employment had fallen nearly three points and held there. The recession did not just cost jobs for a while. It changed which jobs the economy had at all.
Caveat
This is the 2006-2015 window and nothing outside it. I am using the BLS levels as given, not seasonally adjusting anything myself, and “goods-producing,” “construction,” and the rest are the dataset’s own sector definitions. Whatever happened to construction after 2015 is not in here. Within the decade I have, the pattern is hard to miss: the sectors that build things lost the most and recovered the least, and the job mix tilted toward services in the span of a single recession.