// article
Predicting Titanic Survival
The random forest lost. By 0.002 AUC.
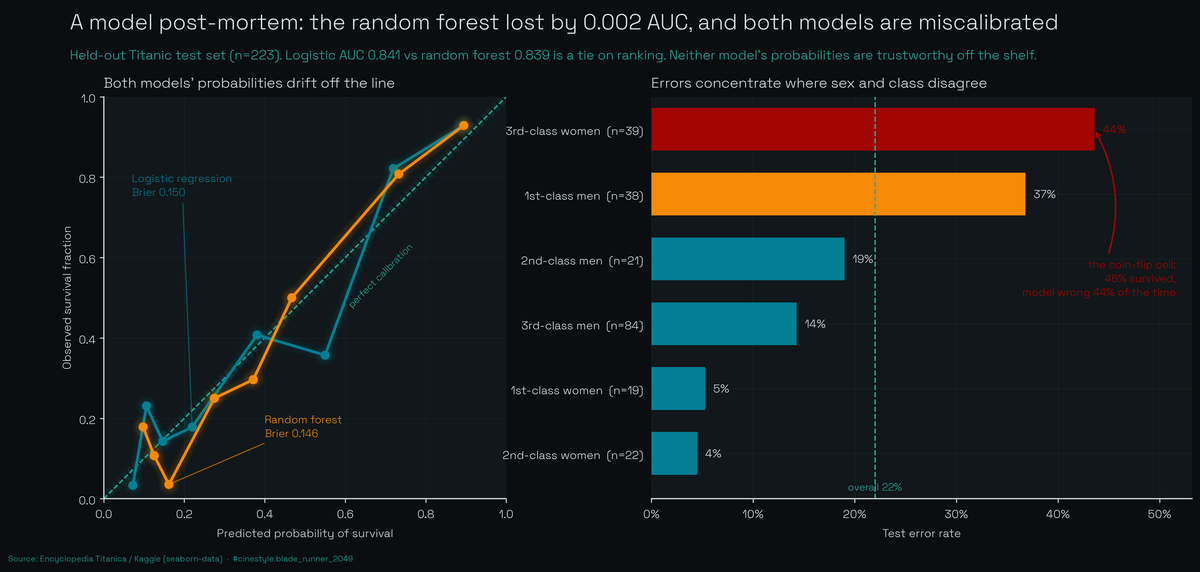
A bigger model is supposed to win. On the Titanic it does not. The two models tie on ranking (0.841 vs 0.839 AUC), both miscalibrate their probabilities, and the errors pile up in one cell: 3rd-class women, wrong 44% of the time. The rest of the piece is me showing the work.
I trained a random forest on the Titanic and it scored 0.839 AUC on the held-out test set. The plain logistic regression scored 0.841. The forest, with 400 trees and a tuned depth, came in two thousandths of a point behind the linear model I could have fit in my head. The bigger model lost.
There is a reflex in this work where reaching for a bigger model feels like progress. So I ran the honest version: same data, same split, and let the complexity earn its keep or not. The data is the 891-passenger Titanic training subset (Encyclopedia Titanica via Kaggle, the one that ships with seaborn). I held out 25% as a test set with a fixed seed, stratified on survival, and never let any preprocessing touch it. Median age imputation, the one-hot encoders, the scaler: all of it fit inside a scikit-learn Pipeline on the 668 training rows only. The 223 test rows stayed sealed until the final score. Every number below comes from that test set.
Three models, one tie
Here is the board:
| model | test accuracy | test AUC | Brier |
|---|---|---|---|
| logistic regression | 0.780 | 0.841 | 0.150 |
| random forest | 0.807 | 0.839 | 0.146 |
| gradient boosting | 0.803 | 0.835 | 0.146 |
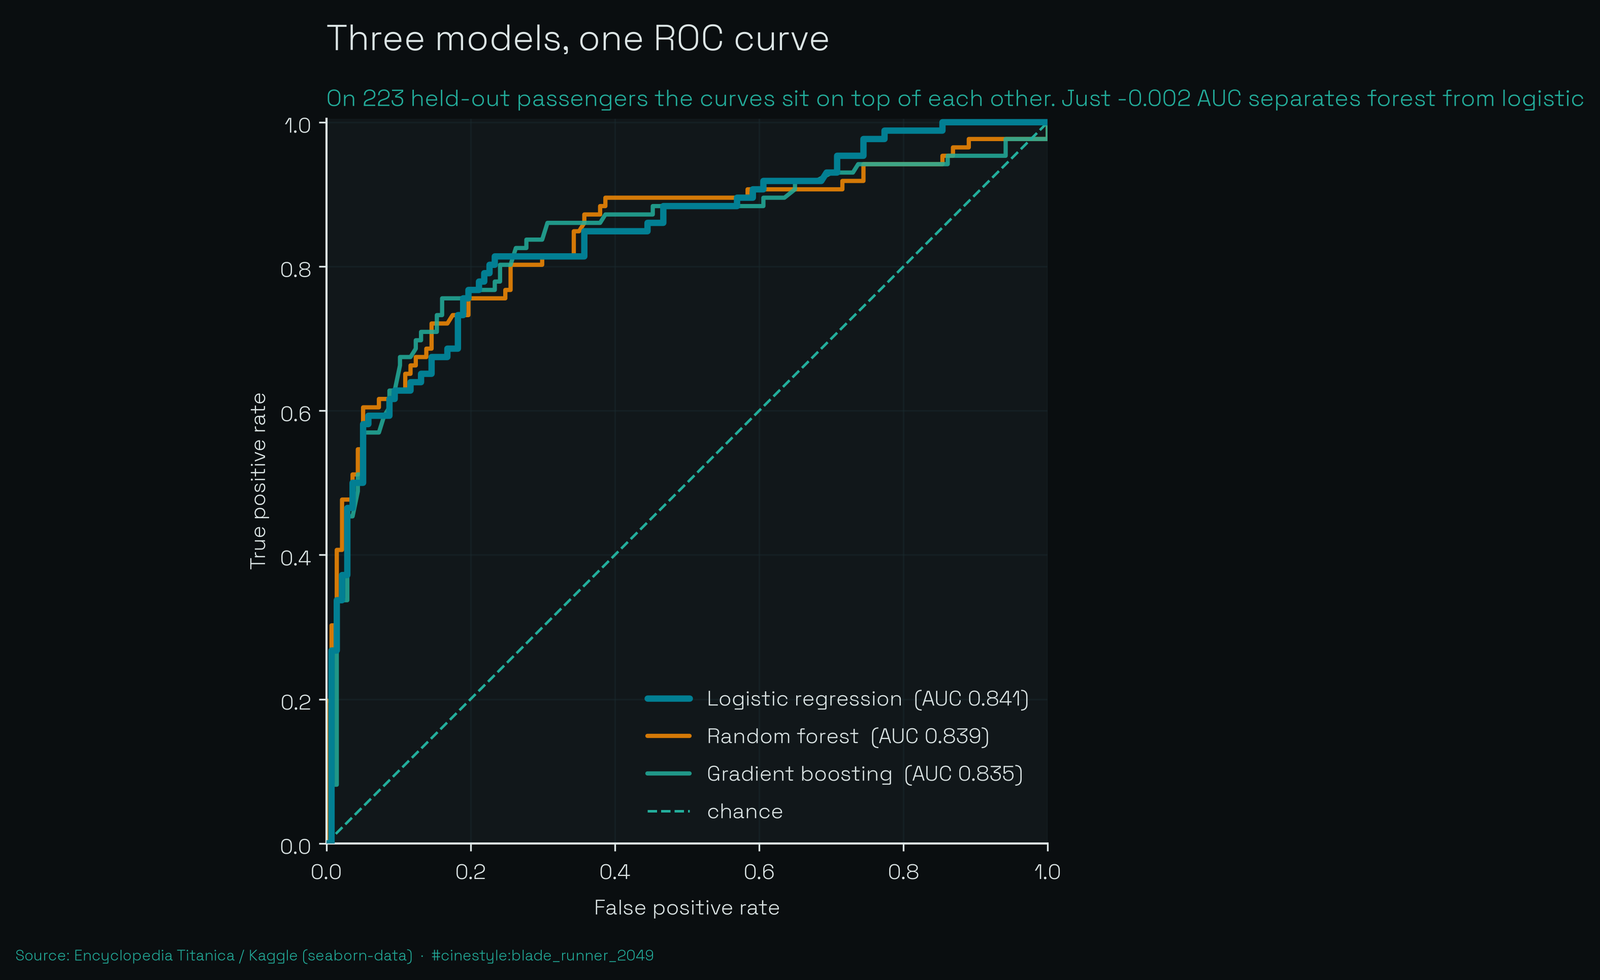
The forest wins accuracy by 2.7 points and loses AUC by 0.002. Gradient boosting trails on both. The ROC curves sit on top of each other. There is no daylight a stakeholder would care about.
The reason is structural. Survival here is mostly a story of two variables, sex and class, and a linear model in log-odds handles that cleanly. The forest’s whole advantage is finding interactions and curvature, and once you know someone’s sex and which deck they paid for, there is little of either left to find. I gave the trees four extra features the first model in this series did not lean on (number of siblings and spouses aboard, parents and children, port of embarkation), and they barely registered. So I would ship the logistic regression. It is faster, it explains itself in one line, and it is tied on ranking.
Except for one thing the accuracy column hides.
The probabilities are lying a little
Accuracy only asks whether the model got the coin-flip right. I care more whether a predicted 70% actually means 70%. A calibration curve checks that directly: bin the predictions, and in each bin compare the predicted probability against the fraction that actually survived. On a perfect model those two are equal and every point lands on the diagonal.
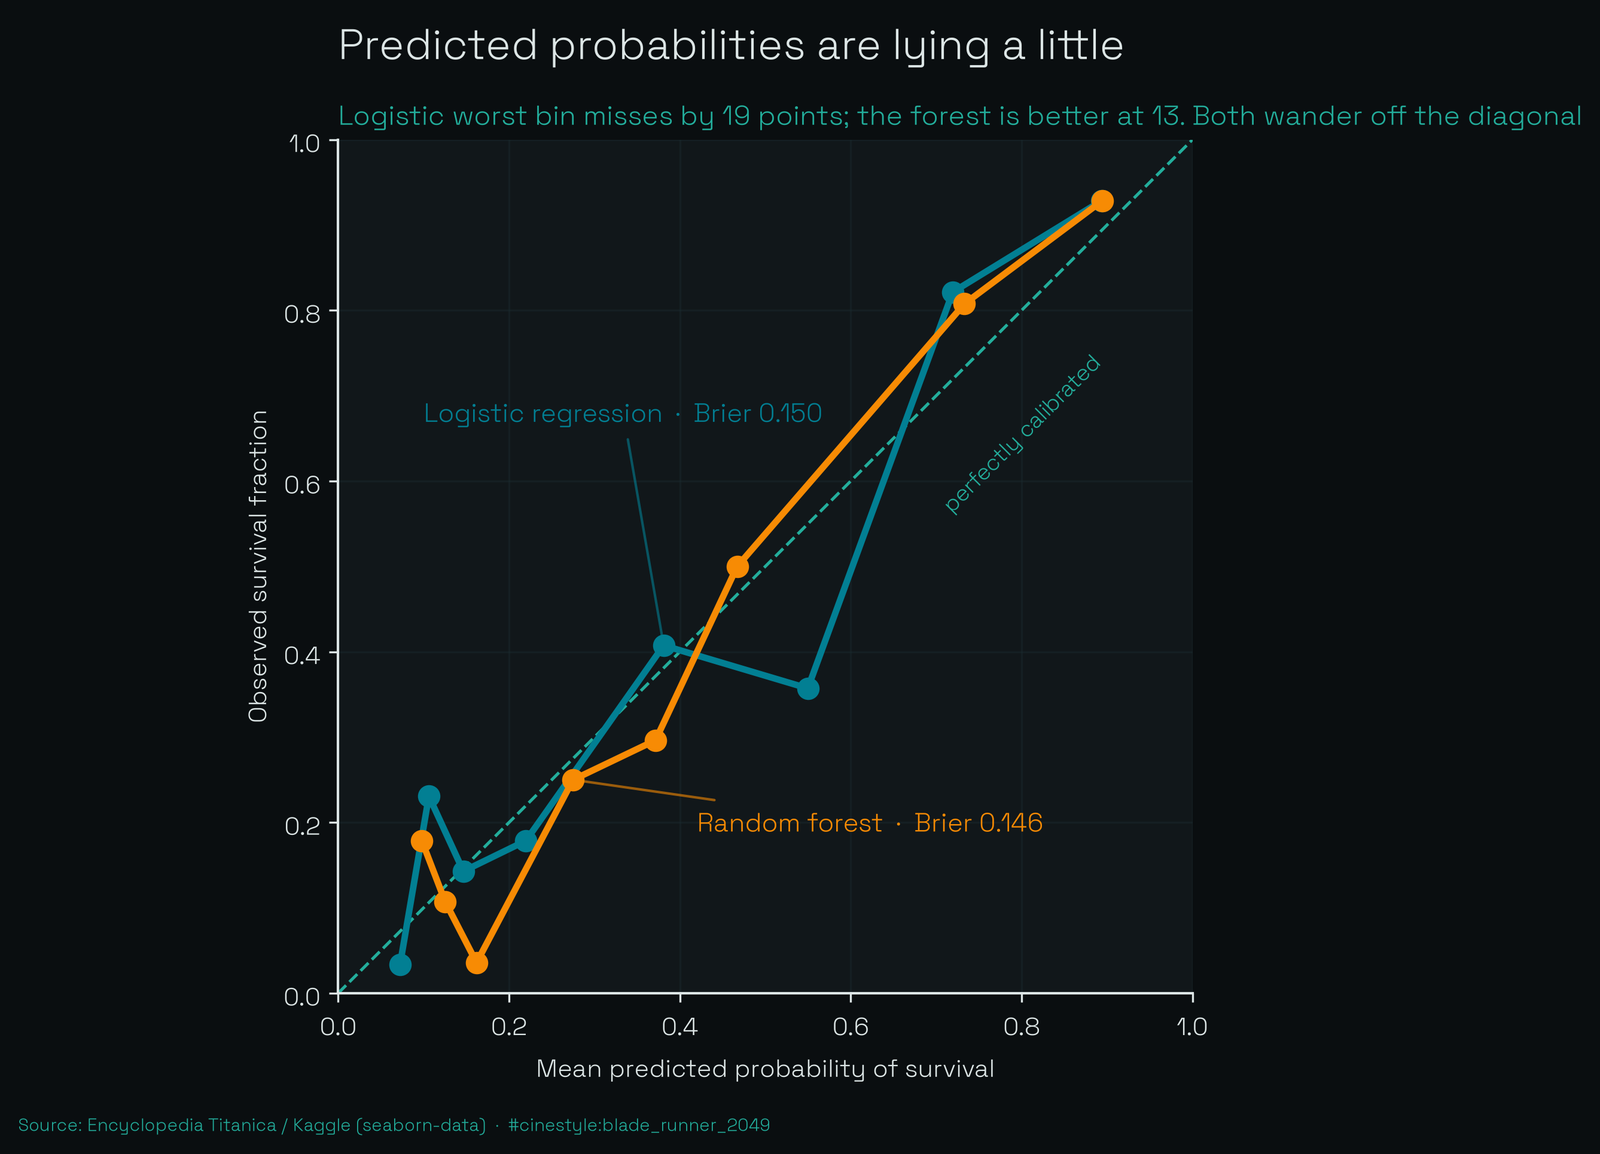
The logistic curve wanders off the diagonal. Its worst bin sits 0.19 away from where it should be, a predicted probability that misses the real survival rate by nearly twenty points. By my threshold that is miscalibrated. The forest is better here, with a worst-bin gap of 0.126 and a slightly lower Brier score (0.146 vs 0.150). This is the one place the extra machinery pays off: averaging 400 trees smooths the probability estimates even when it does not move the ranking. On 223 test points the calibration bins are thin, so I will not oversell the exact shape, but the direction is consistent across both models. The logistic model ranks just as well, but you should not trust its percentages until you have run a calibration pass.
Who the model gets wrong
This is the part I find more useful than any leaderboard. The logistic model misses 22% of the test set. I reattached the raw passenger attributes to the errors and broke the error rate down by sex and class.
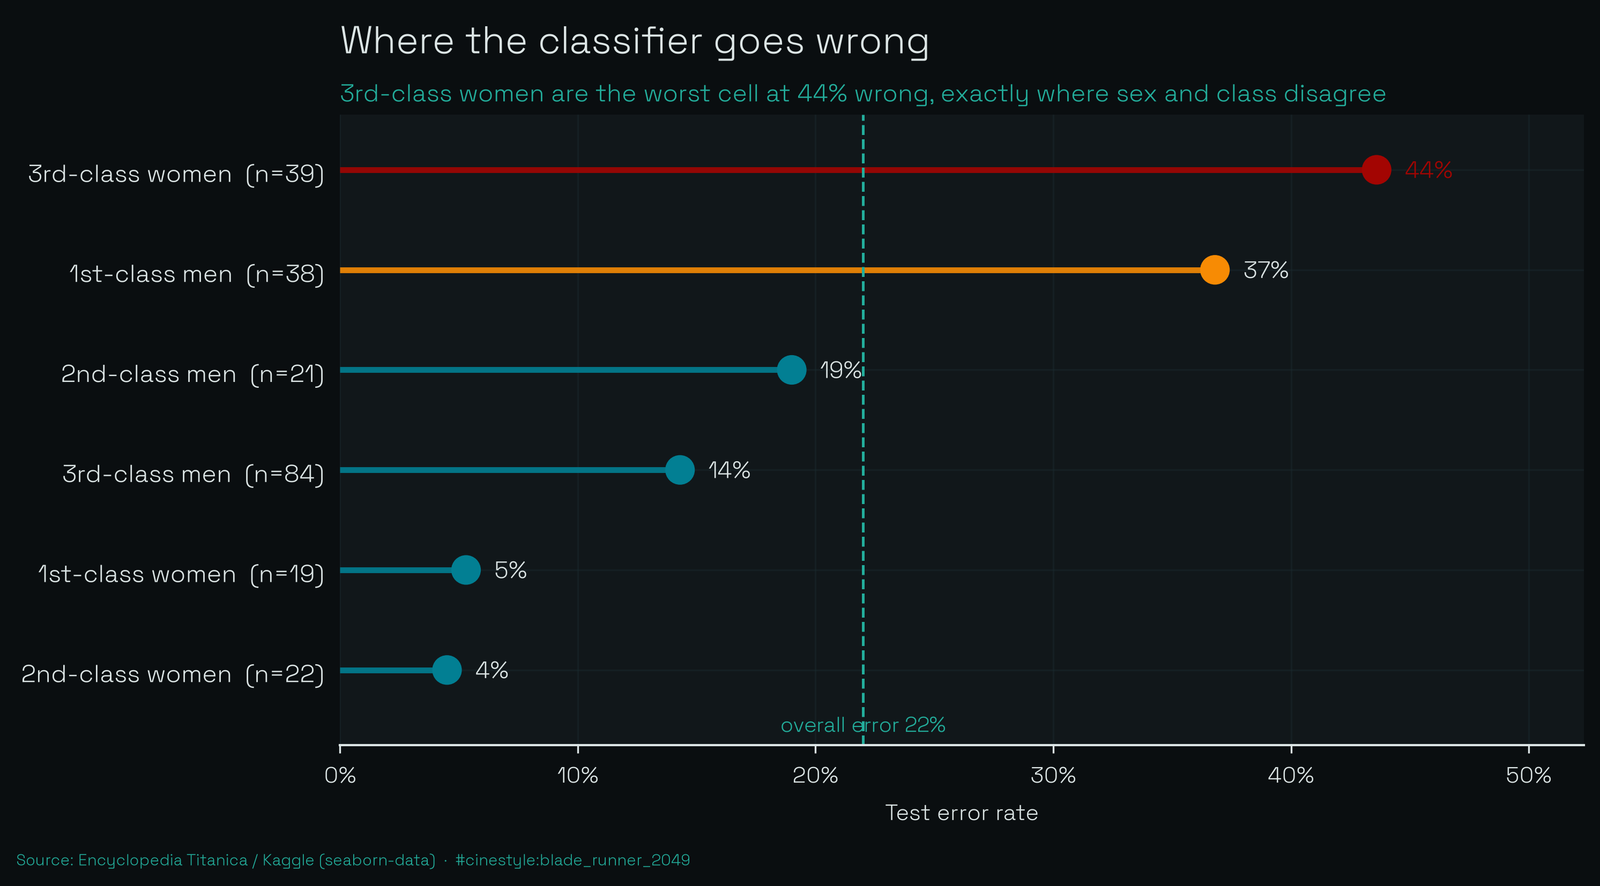
The pattern is stark. The model is nearly perfect on the easy corners. First- and second-class women, where it is wrong 1 time in 19 and 1 in 22, because almost all of them survived and the model knows it. Third-class men it gets right 86% of the time, because almost all of them died. The model is essentially memorizing one slogan: women live, men die. A baseline that only predicts “female survives, male dies” hits 0.767 accuracy on this same test set, barely behind the logistic model’s 0.780. All the fitting buys about one point over a rule a child could state.
The errors pile up exactly where the slogan breaks. Third-class women are the single worst cell: 39 of them in the test set, and the model botches 44% of those calls. They are the coin-flip group, 46% survived and the rest did not, and the model, leaning on “woman, so probably survived,” guesses wrong almost half the time. Three of them survived and the model had already written them off.
The other failure mode is first-class men. Twenty-five of the 38 in the test set died, but the model’s instinct is “first class, decent odds,” so it bet survival on five men who did not make it. Picture sex and class as two arrows pushing on each prediction. For most passengers they point the same way and the model coasts. For third-class women and first-class men they point in opposite directions, and a linear model can only add the arrows, never resolve them. Neither can the forest. I checked, and it makes its mistakes in the same two cells.
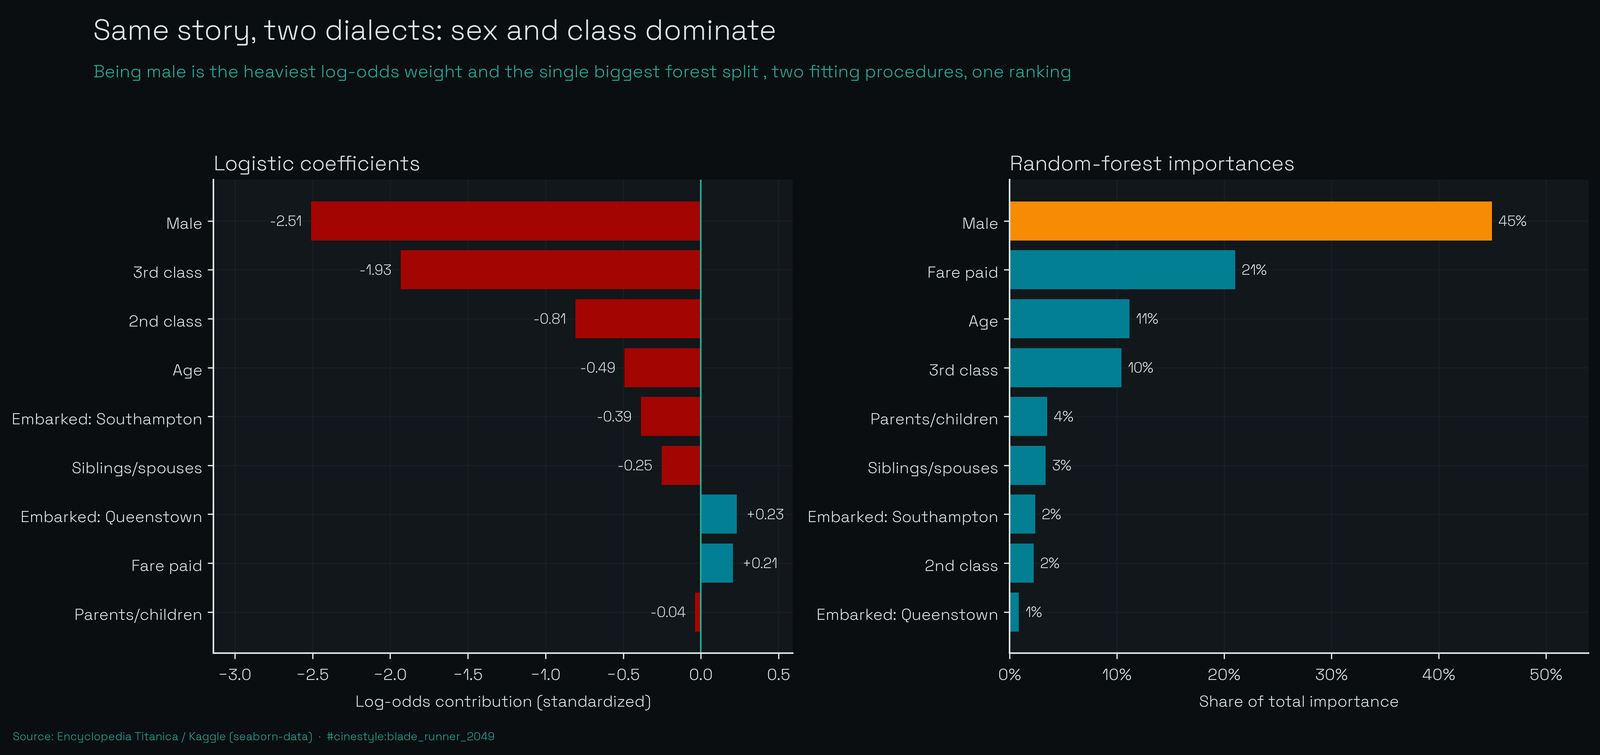
When I line up the logistic coefficients against the forest’s importances, they tell the same story in two dialects. The logistic model’s biggest weight by far is being male (coefficient -2.51 in log-odds), then third class (-1.93), then age (-0.49). The forest agrees: sex carries 45% of its importance, then fare and third class. Two completely different fitting procedures landed on one ranking. That is reassuring and a little deflating. The forest unlocked no secret structure. There is sex, class, and a fog of individual luck the data cannot see.
What I would actually do with this
Ship the logistic model, but run it through a calibration step before anyone reads its probabilities as probabilities. That is the one concrete defect the test set surfaced. Do not reach for the forest expecting a lift; on this problem there is none to reach for. And treat the 78% ceiling as a feature of the world, not a failure of the model: the misses concentrate in the exact passengers whose survival sex and class could not agree on, and no amount of model complexity invents the information that would settle it.
One honesty note, the same one that shadows everything built on this dataset: it is 891 rows, age is missing for 177 of them (about 20%) and filled with a median inside the pipeline, and the test set is 223 people. The 0.002 AUC gap would wobble under a different seed. I would not bet the third decimal. I would bet the conclusion, because the coefficients, the importances, and the baseline all keep pointing at it.