// article
The Sound of a Hit
What a popular song actually sounds like, according to 28,000 of them
A hit song does not have a sound you can measure. I pulled 28,356 unique tracks off Spotify, each one tagged with ten audio features the platform computes itself, danceability, energy, loudness, valence, tempo, and the rest, plus a popularity score from 0 to 100. The obvious question was which of those numbers a hit is made of. The honest answer is none of them, and that turned out to be the interesting part.
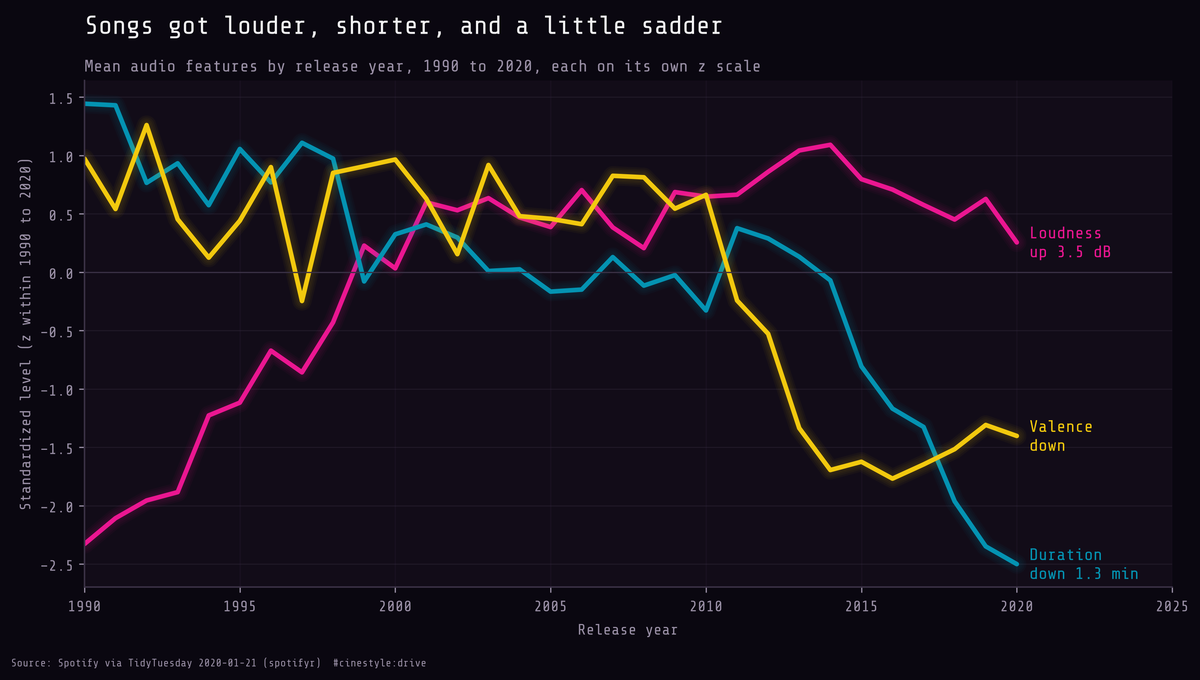
The chart above is the one finding that did move. Across thirty years of release dates, songs got louder, they got shorter by more than a minute, and they got a little less cheerful. Each line is on its own z scale, so this is about direction and pace, not which feature is biggest. The audio of a song says almost nothing about whether it will be popular, but it says a lot about which decade it came from.
The data
The set is the TidyTuesday Spotify release from January 2020, originally pulled with the spotifyr package. It is 32,833 playlist entries across six playlist genres, roughly balanced: edm, rap, pop, r&b, latin, and rock all land between 4,951 and 6,043 entries. The same track can sit on several playlists, so those rows hold 28,356 unique tracks. Everything about popularity and release year below runs on the unique tracks; the genre profiles keep every playlist entry, because a track on both an edm and a pop playlist really does count toward both. Each row carries Spotify’s own audio features on a 0 to 1 scale (danceability, energy, valence, acousticness, and so on), plus loudness in decibels, tempo in BPM, duration in milliseconds, a release date, and the track popularity score. Mean popularity is 39.3 with a standard deviation of 23.7, so the target has plenty of spread to explain. The question is whether the audio explains any of it.
No single feature predicts a hit
I correlated every audio feature against popularity. The strongest relationship in the entire set is duration at r = -0.14. It explains 2.0% of the variance in popularity, which is another way of saying it explains essentially nothing.
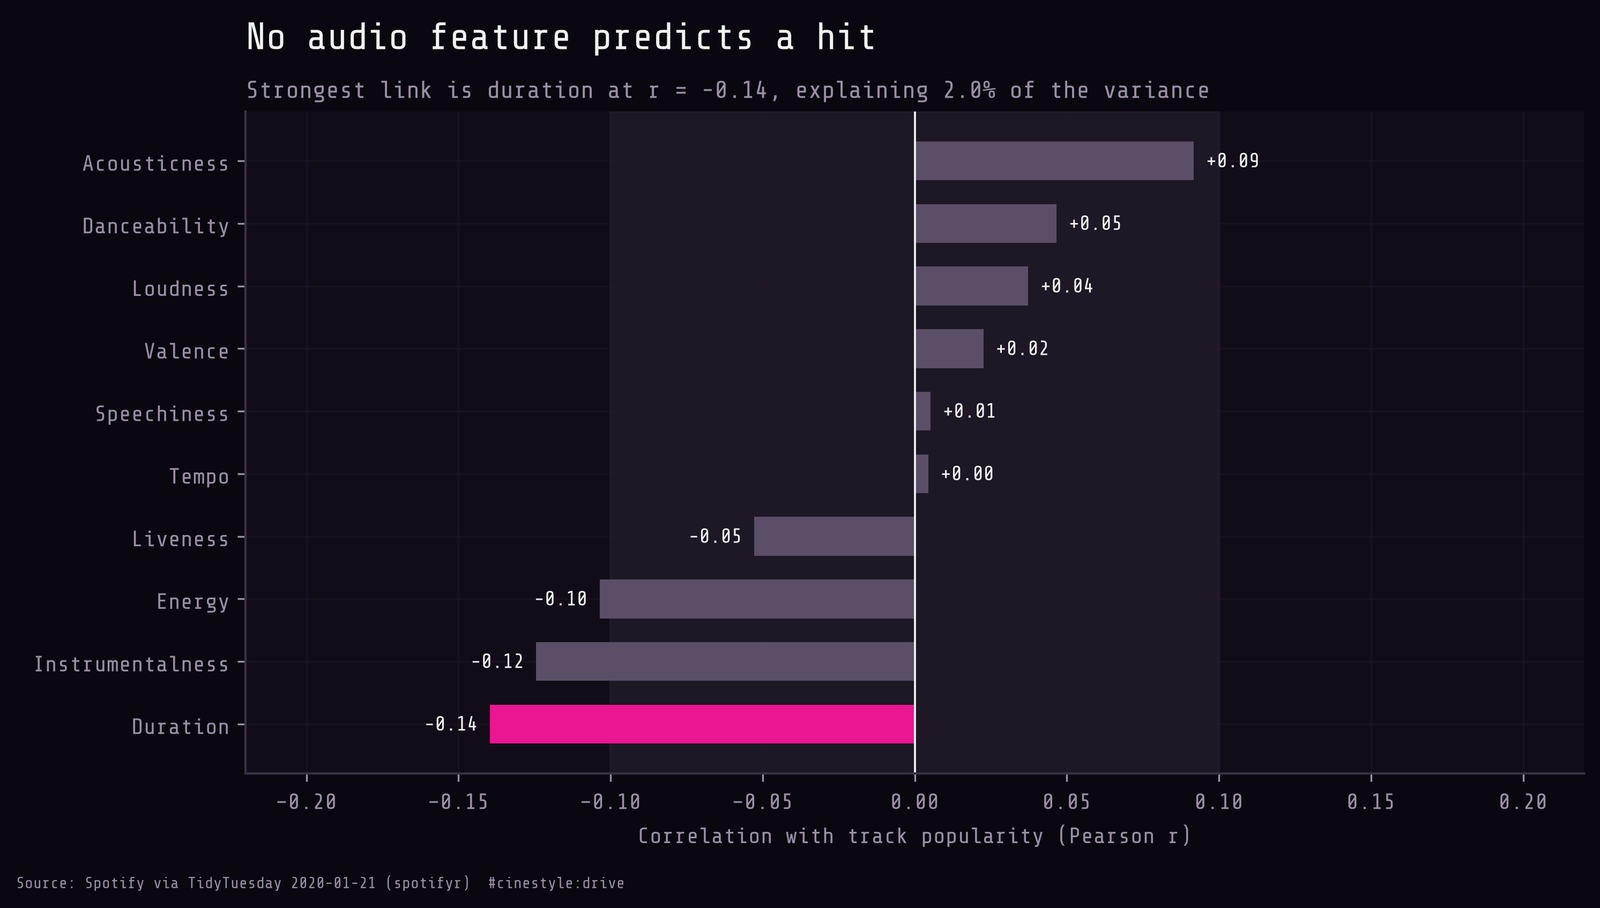
Every bar sits inside a hand’s width of zero. The full list, most negative first: duration -0.14, instrumentalness -0.12, energy -0.10, liveness -0.05, tempo 0.00, speechiness 0.01, valence 0.02, loudness 0.04, danceability 0.05, acousticness 0.09. Longer songs score slightly lower, purely instrumental ones slightly lower, and higher-energy ones slightly lower. Each of those is a real, statistically detectable nudge on a sample this size, and each is so small that you could not feel it choosing a playlist. The feature that “predicts” popularity best is length, and all it says is that shorter songs do a little better.
I want to be plain about what this is not. It is not a claim that audio does not matter to music. It is a claim that the audio Spotify can measure does not separate the popular tracks from the rest. Popularity lives somewhere these ten numbers cannot see.
The model gives up too
A single feature is a low bar. Maybe popularity hides in a combination, loud and short and danceable together, that no one feature catches alone. So I let a model look for it.
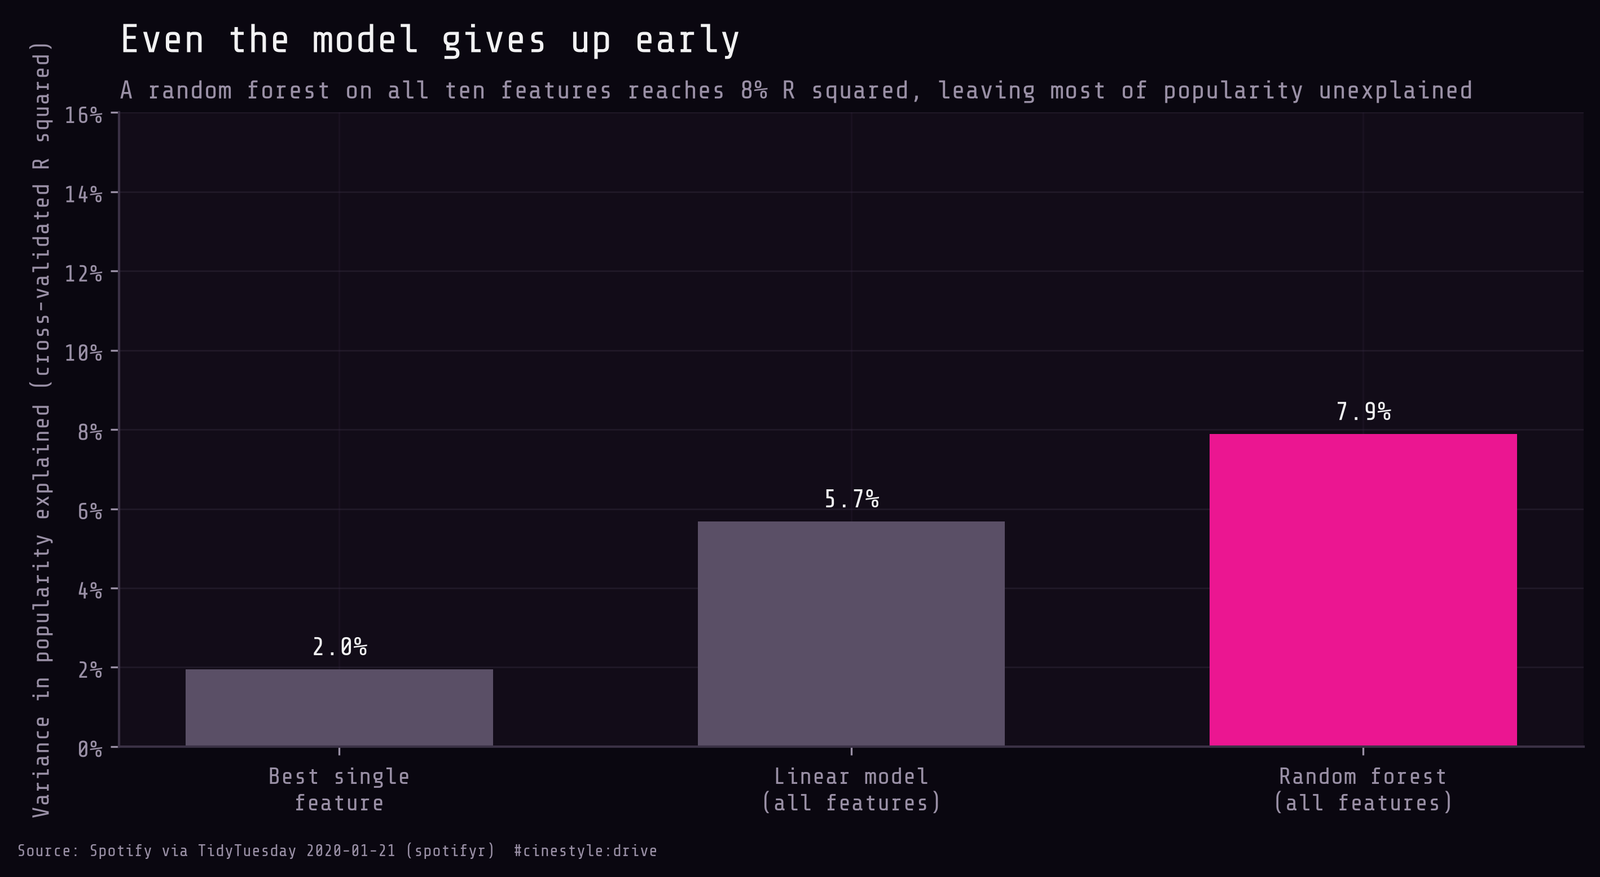
I cross-validated on five shuffled folds. The shuffle matters here: the source file is sorted by genre, and unshuffled folds hold out one genre-shaped slice at a time. A linear model on all ten features explains 5.7% of the variance, a few points over the best single feature. A random forest, which can chase any interaction it likes, reaches 7.9%. That is the ceiling: hand a flexible model every audio number Spotify has, and more than nine tenths of the popularity story is still missing. The things that make a song a hit, the artist, the marketing, the moment, the playlist placement, are not in this file, and the audio cannot stand in for them.
Each genre has a fingerprint
Audio does little for popularity and a great deal for genre. The same ten numbers that cannot find a hit draw a sharp portrait of what each genre sounds like.
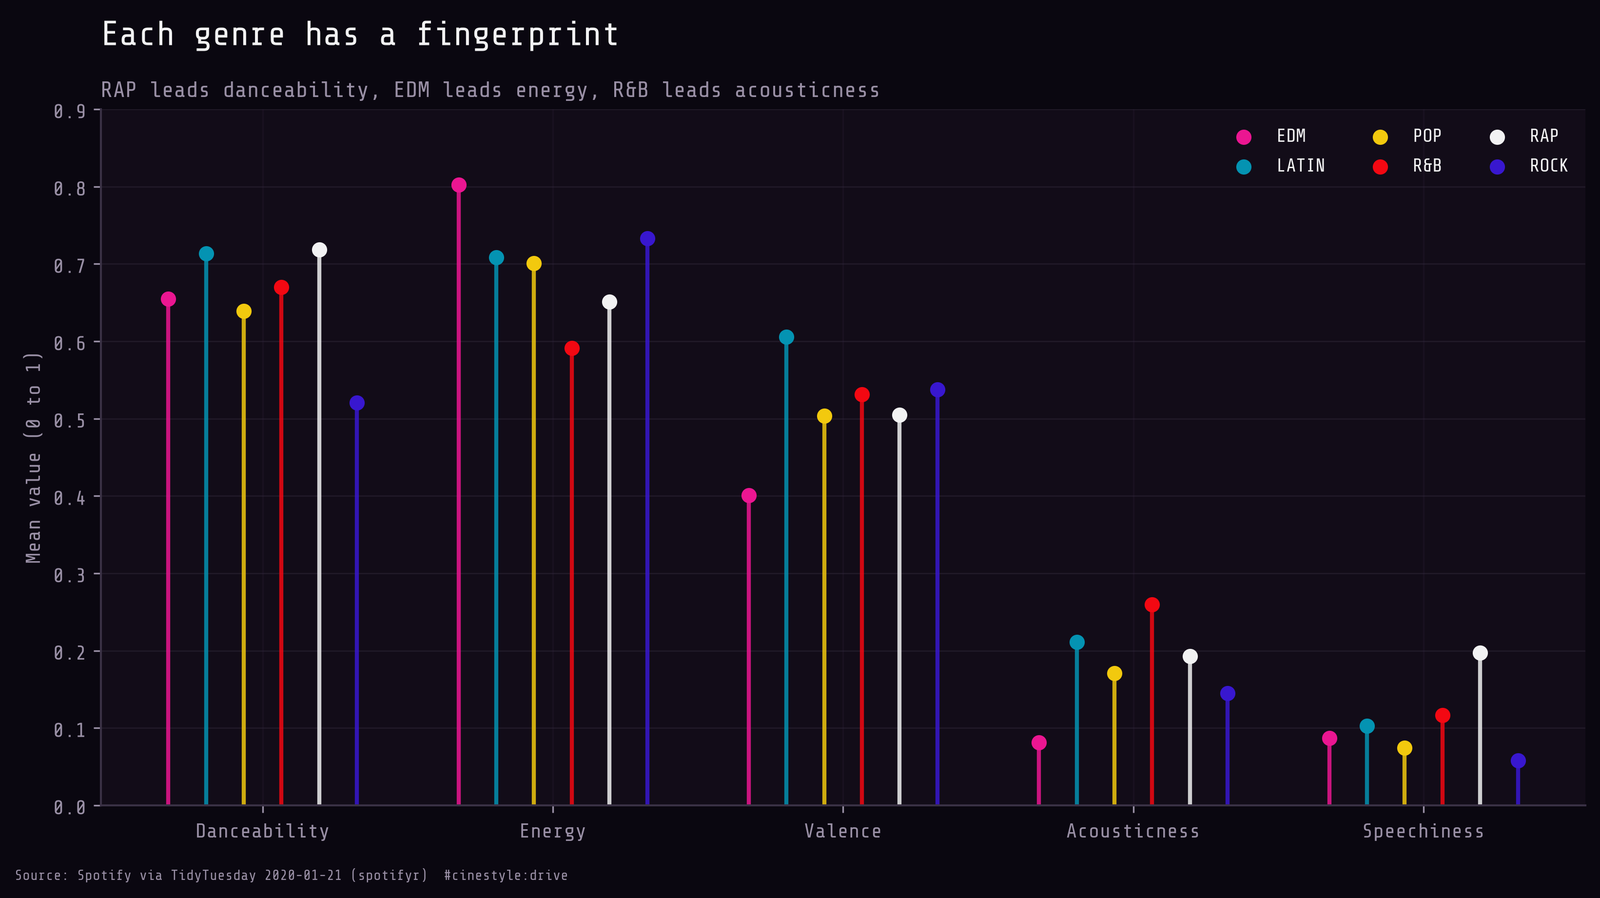
Rap is the most danceable and by far the most speech-heavy, at 0.20 speechiness against rock’s 0.06. Edm is the most energetic at 0.80, and the least acoustic and least positive, the sound of a machine that does not get tired or sad. R&b is the most acoustic and the calmest. Latin is the happiest, topping valence at 0.61. Rock is the least danceable by a clear margin. These are averages over thousands of tracks each, and they line up with what your ear already tells you, which is the point. Genre itself moves popularity more than any audio number does: pop playlists average 47.7 and latin 47.0, against 34.8 for edm. The features know what a song is, not whether anyone will like it.
What actually changed: the era, not the hit
Which brings the story back to time. I restricted to 1990 through 2020, where every year has a real sample, and tracked the means. Three features move, duration most clearly.
Loudness climbs from -10.0 dB in 1990 to -6.4 dB in 2019, a rise of about 3.5 dB, the audible signature of the loudness war that compression and mastering have waged across pop. Duration falls from 4.6 minutes to 3.3, losing about 1.3 minutes per track, the streaming-era pressure to reach the hook before a listener skips. Valence, Spotify’s measure of musical positivity, drifts down from 0.62 to 0.48. Per year, that is +0.11 dB of loudness (r = 0.16), about 2 seconds less duration (r = -0.35), and -0.005 of valence (r = -0.21). Duration is the only one of the three I would call a firm trend.
None of these three predicts popularity either. Louder songs are not more popular (r = 0.04), and shorter songs are only slightly more so (duration r = -0.14). The trends are about supply, not success. The average song got louder and shorter because production and platforms changed, not because listeners rewarded loud and short. One caution: these are tracks on 2020-era playlists, so the 1990 songs here are the ones that survived onto current playlists, not a sample of what 1990 released. The audio features failed to find the hit and succeeded at dating the track.
The honest finish
I came to this set expecting a recipe and found a clock. You cannot read popularity off the waveform; the best single feature explains 2.0% and a model stalls at 7.9%, and that is a real result, not a failure of effort. What you can read is the year: louder, shorter, a shade sadder than thirty years ago. Whether anyone loved a song is written somewhere else.