// article
Penguin Dimorphism
A female Gentoo outweighs a male Adelie by 636 grams
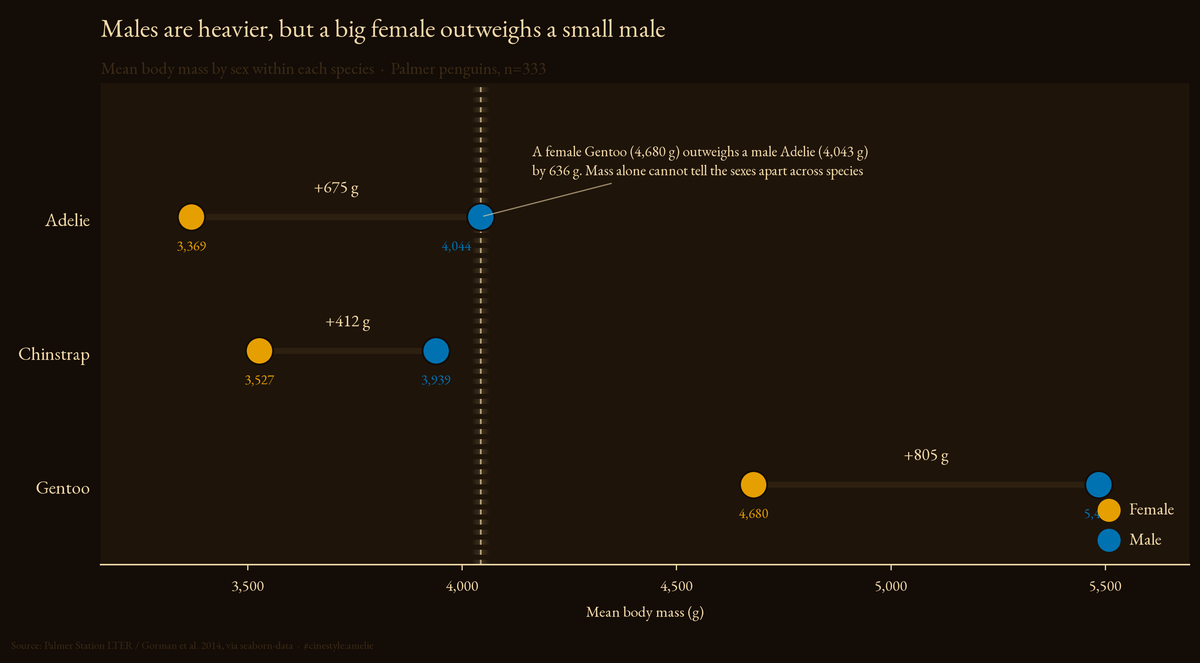
Within each penguin species the male is heavier than the female, every time. That rule holds in the data and it tempts you to predict sex from size alone. It breaks the moment you compare across species: the female Gentoo sits a full 636 grams past the male Adelie.
Predict a penguin’s sex from its measurements, one species at a time, and you are right about 92% of the time on held-out birds. That is the number I went in chasing, and I got it. What I did not expect was that pooling all three species together, ignoring the thing every textbook calls a confound, landed in the same place. The naive model was supposed to fall on its face. It did not.
The data is the Palmer Penguins set (Palmer Station LTER / Gorman et al. 2014, via seaborn-data). Each row is one bird: bill length, bill depth, flipper length, body mass in grams, plus species and sex. Sex is the messiest column. It is blank in 11 of the 344 rows, and the 2 rows missing all four measurements are a subset of those. Drop every row missing any measurement or the sex label and 333 birds remain: 146 Adelie, 119 Gentoo, 68 Chinstrap. The sex split is almost dead even, 168 males to 165 females, so a coin flip scores 50% and the baseline is clean.
The reason species is supposed to wreck this is a size argument. Penguins are sexually dimorphic, males running bigger, but the between-species size gap dwarfs the within-species sex gap. Picture the body-mass axis as a single ruler with no species labels on it. A female Gentoo averages 4679.7g; a male Adelie averages 4043.5g. The female of the big species lands 636.2g past the male of the small species. Hand a model raw body mass and no species, and a heavy bird could be a male Adelie or a female Gentoo, with mass unable to say which. The confound is not subtle.
Three models, one split
I set up a stratified 70/30 split (seed 42, stratified on species and sex so every species keeps both sexes in train and test) and fit three logistic regressions inside scikit-learn Pipelines, scaling inside the pipeline so nothing leaks from test into train:
- Pooled: four measurements, species hidden.
- Species-aware: four measurements plus a one-hot species indicator.
- Per-species: three separate models, one per species.
On the 100-bird test set, all three scored 0.920. Identical. The confound that was supposed to sink the pooled model left no mark on the headline number.
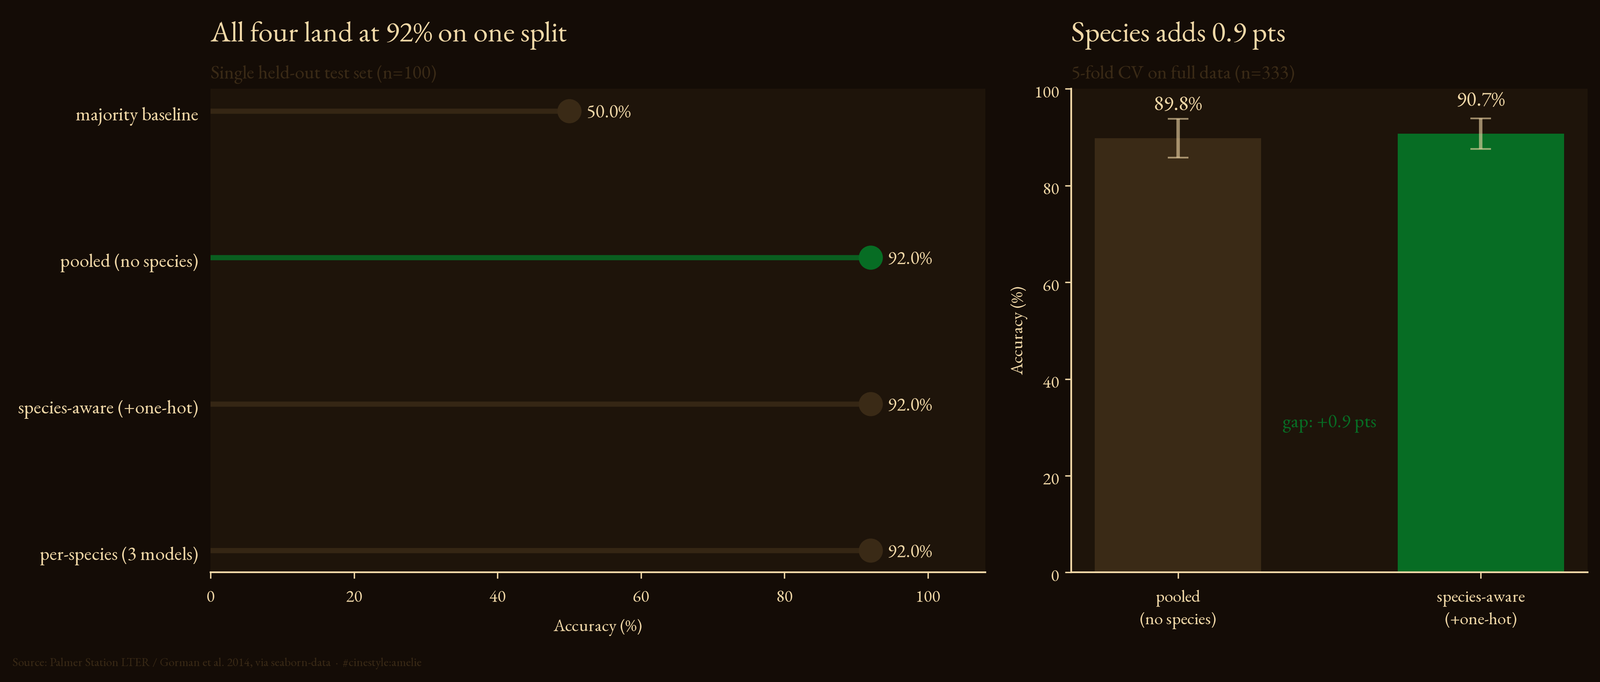
A single 100-row test set is a coarse instrument, and a tie on it can be luck. So I ran 5-fold cross-validation on the full 333 birds for the pooled and species-aware models. The folds bounce around: pooled ranges 0.836 to 0.955 across the five, which is how much a single split can mislead you. Averaged, pooled lands at 0.898 and species-aware at 0.907. The gap is real and it favors knowing the species, 0.9 points. It is also small. The per-species models recover sex at 90.9% for Adelie, 90.0% for Chinstrap, and 94.4% for Gentoo on the test set. Gentoos are the easiest sex call, and the effect sizes say why.
Where the size lives
To rank measurements by how cleanly they split the sexes, I used Cohen’s d (male minus female) computed within each species, so the species gap cannot contaminate it. Body mass is the most dimorphic measurement overall, mean absolute d of 2.045 across the three species. Bill depth is close behind at 1.97. Flipper length, the measurement that screams species, is the weakest sex signal within a species at 1.319.
That inversion is the whole story. Flipper length is the most species-dominated axis in the data: the spread of species means is nearly twice the average within-species sex gap, a ratio of 1.98. It is a fine species detector and a mediocre sex detector. Body mass runs the other way. Within a Gentoo, males and females separate by a Cohen’s d of 2.70, a chasm. Pull mass apart across species and that same gap goes muddy.
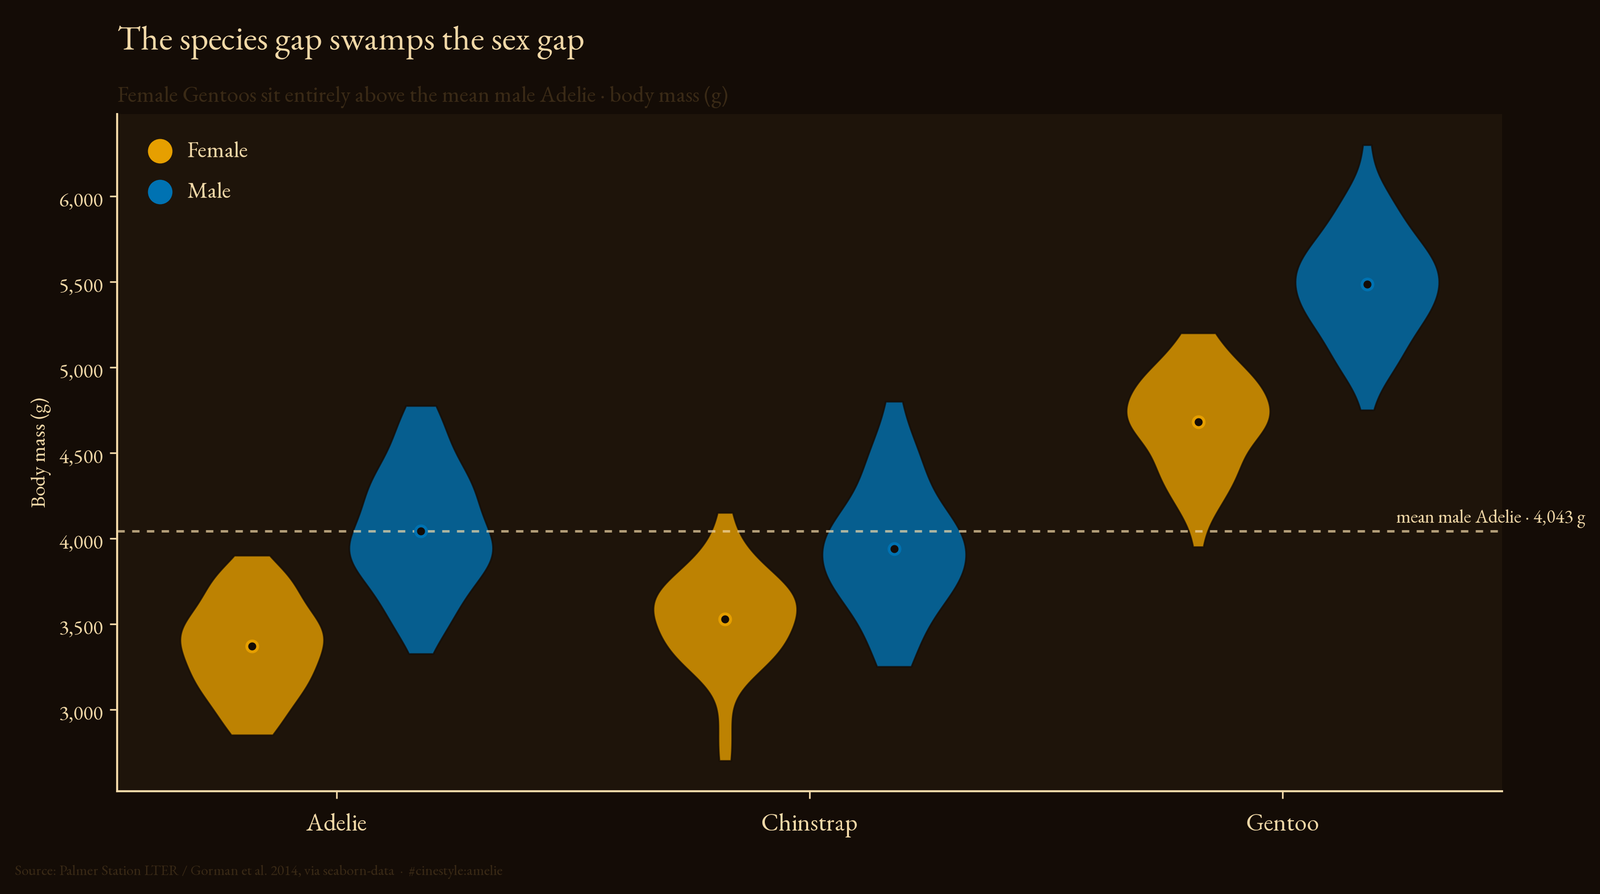
The violins make the confound visible. The dashed line sits at the mean male-Adelie mass. Female Gentoos float well above it. With only the y-axis to go on, a bird between those two means is unplaceable; it could be either. Give the model bill depth and flipper length alongside mass, though, and it can first work out which species it is looking at, then read the within-species mass gap. That is what the pooled model is quietly doing. Logistic regression on four correlated measurements reconstructs the species structure on its own, so an explicit species label only buys the last 0.9 points it could not already infer.
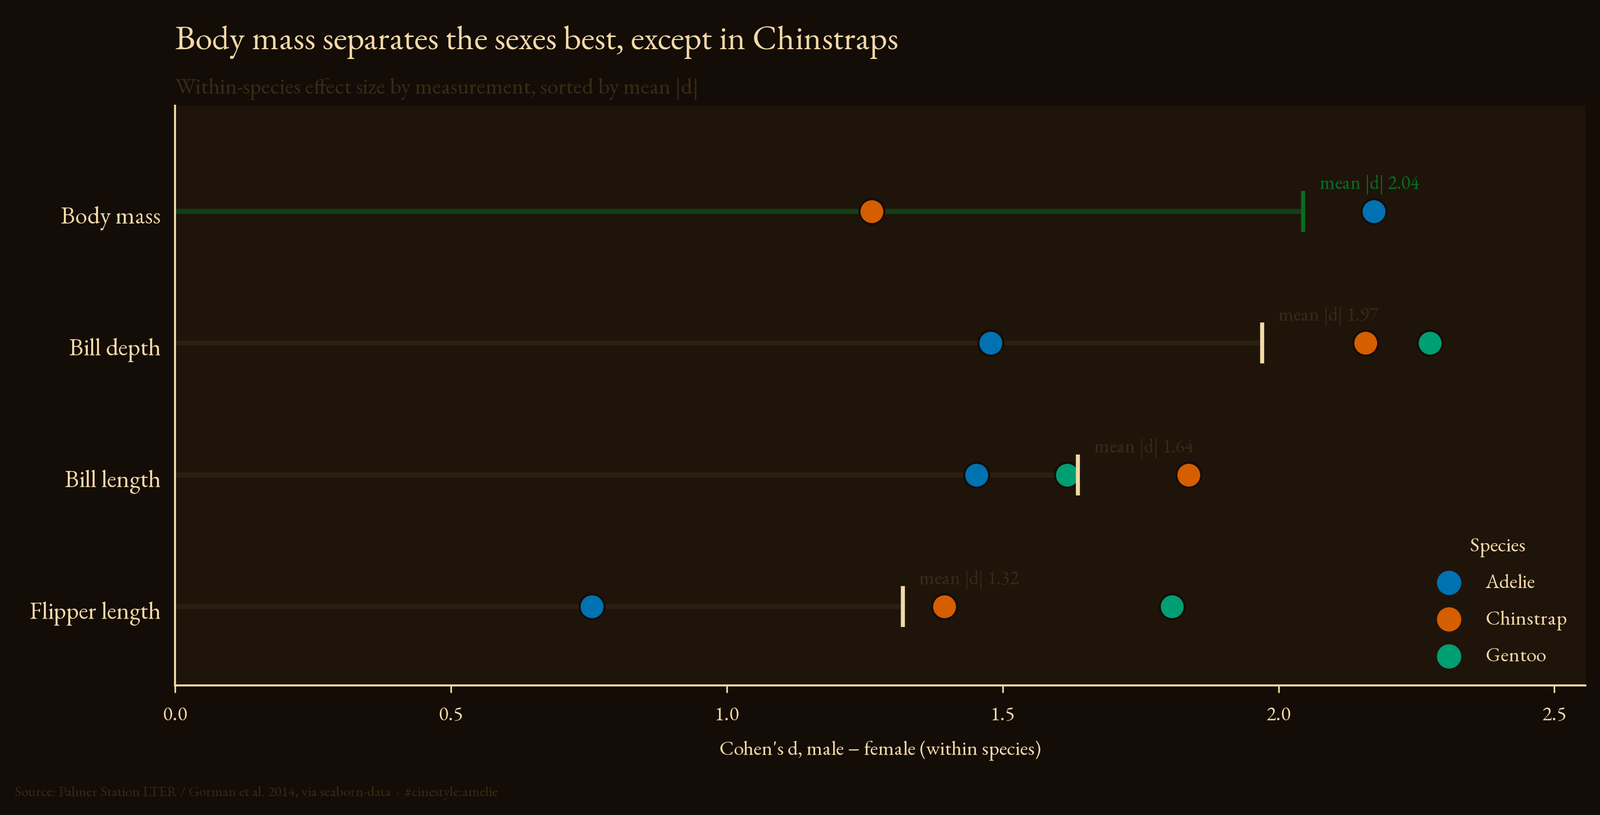
The per-measurement, per-species chart shows there is no single universal dimorphism rule. For Adelie and Gentoo, body mass is the strongest sex signal. For Chinstrap, it is bill depth (d=2.158), and body mass is the weakest of the four (1.263). A model that assumed mass is always the best sex cue would do worst exactly on Chinstrap, which is why the per-species Chinstrap accuracy of 90.0% is the lowest of the three.
The caveat I am keeping
This is 333 birds from one archipelago, three species, measured in two summers. The within-Chinstrap numbers rest on 68 birds, 34 of each sex, small enough that the 90.0% test accuracy is really 9 of 10 test Chinstraps called right, and one bird either way swings it hard. I would not ship “body mass is the most dimorphic measurement” as a fact about penguins everywhere. I would ship it as what these 333 birds say.
So the confound is real and the pooled model survives it anyway. Not because the confound does not exist, but because logistic regression on the full measurement set rebuilds the species boundary it was never told about. Drop to body mass alone and the female-Gentoo-versus-male-Adelie overlap bites. Give a model enough columns and it will find the structure you tried to hide from it. The question is whether you would have known that without checking the effect sizes that explain why.