// article
Clustering Penguins
Two penguin measurements beat four
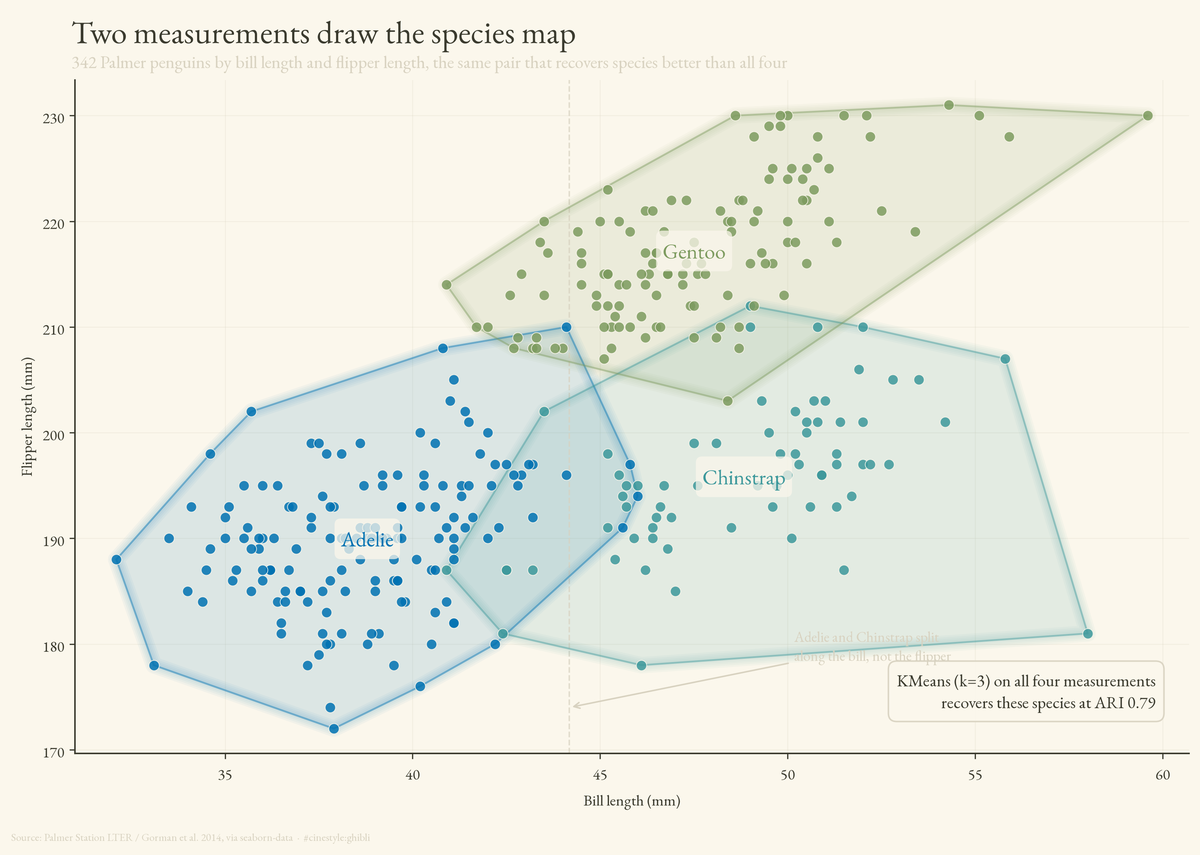
Fewer measurements clustered these penguins more accurately than more measurements. Put the whole dataset on two axes, bill length across and flipper length up, and the three species draw themselves. Gentoo floats off to the top, Adelie sits low and short-billed, and Chinstrap shares Adelie’s flipper range but pulls right on the bill. The two measurements that draw the cleanest map are the same two that beat all four when you hand the data to a clustering algorithm.
This is the result that sent me back to re-run the script. I clustered 342 penguins into three groups using all four body measurements, with no species labels, and the clusters matched the real species at an adjusted Rand index of 0.79. Then I threw away half the measurements, kept only bill length and flipper length, and the match jumped to 0.89. Fewer features, better answer. I expected the opposite.
The data is the Palmer Penguins set (Palmer Station LTER / Gorman et al. 2014, via seaborn-data). It is 344 rows of Adelie, Chinstrap, and Gentoo penguins, each with bill length, bill depth, flipper length, and body mass in grams, plus island and sex. Two rows are missing all four numeric measurements, so I dropped them and worked with 342. (Sex is missing on 11 rows in the raw file, but two of those are the same rows I dropped for missing measurements, so nine sex-blanks ride along in the 342. I did not use sex for anything, so I left them.) After the drop: 151 Adelie, 123 Gentoo, 68 Chinstrap. The dataset is unbalanced, which matters later.
The question is simple. If you hand this data to an algorithm with the species column hidden, how cleanly do the three species fall back out? KMeans with k=3 is the obvious first swing. Standardize the four features so body mass in the thousands does not drown out bill depth in the teens, run it, then line the clusters up against the truth. The honest test is whether the algorithm rediscovers what the field biologist already labeled.
The thing body mass does to you
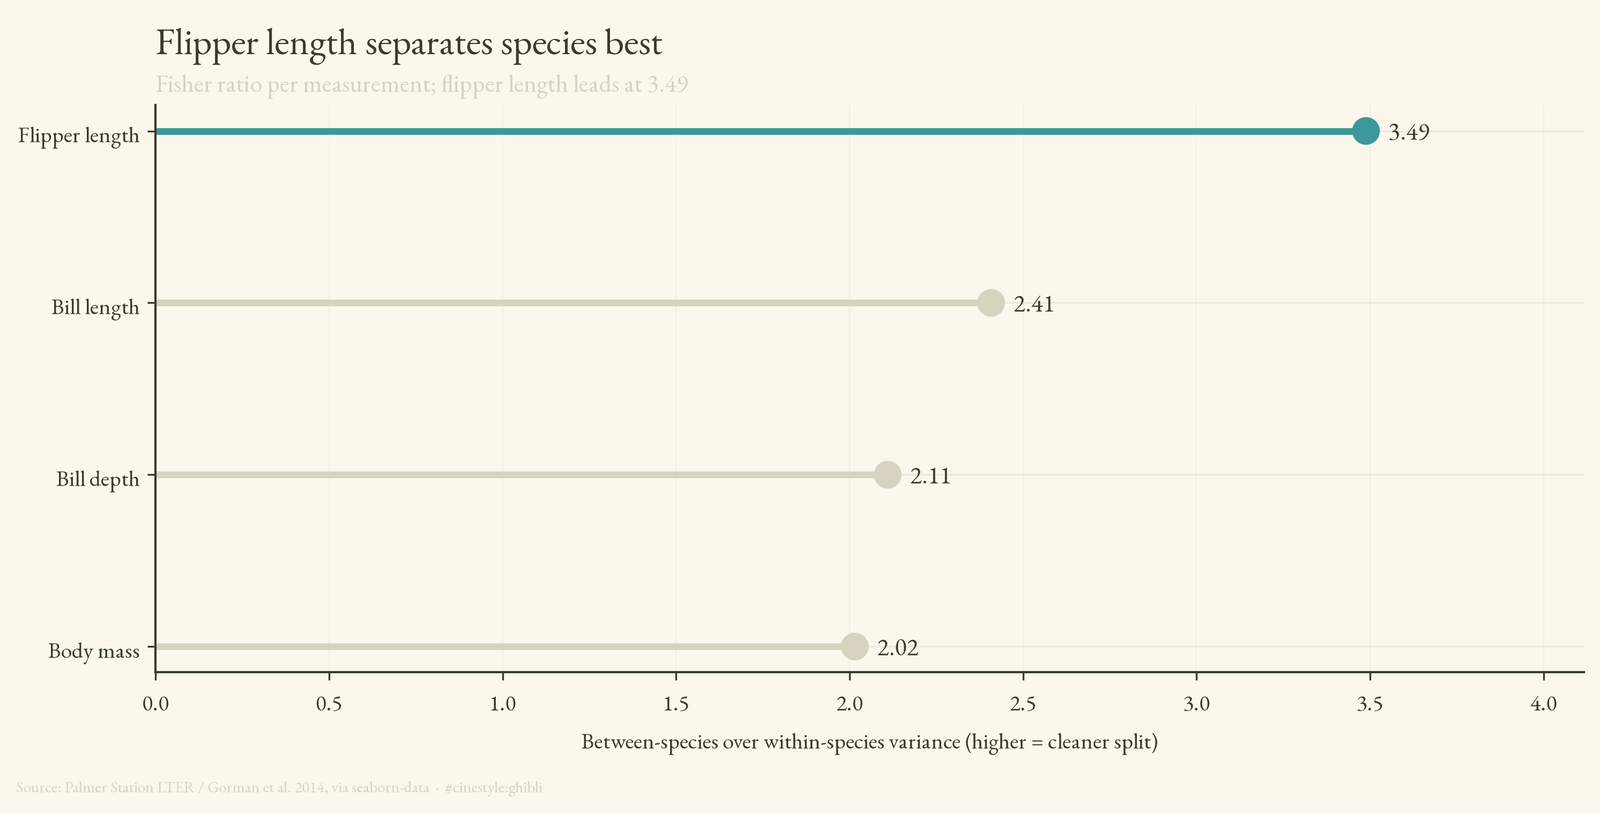
The separation between species is not evenly spread across the four measurements. I scored each one with a between-group over within-group variance ratio, the 1D Fisher idea: how far apart the species means sit relative to the spread inside each species. Flipper length wins at 3.49. Bill length is next at 2.41, then bill depth at 2.11, and body mass comes last at 2.02.
That body mass score surprised me, because Gentoos are heavy. Their mean body mass is 5076g against roughly 3700g for the other two. That gap is exactly the problem. Body mass separates Gentoo cleanly and does almost nothing for the Adelie versus Chinstrap split, where both sit around 3700g. A feature that splits one species off and leaves the other two tangled is not pulling its weight in a three-way clustering.
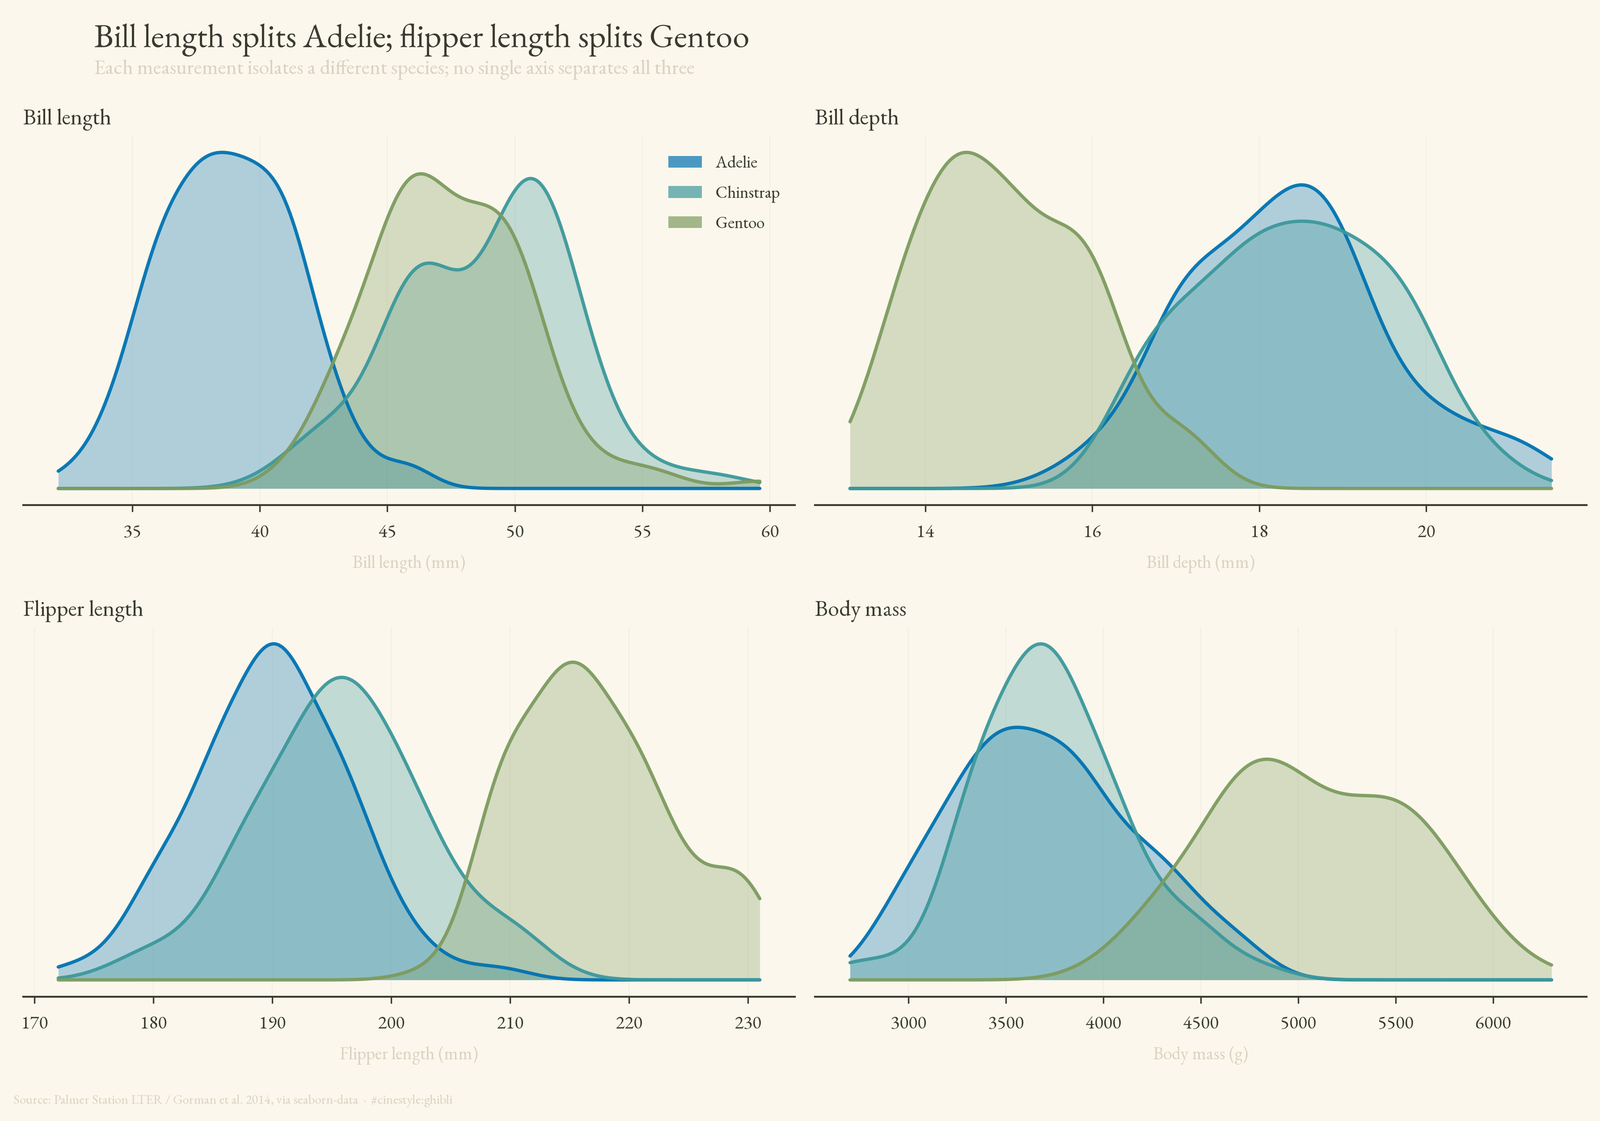
You can see it in the density curves. Flipper length pushes Gentoo way out to the right and leaves Adelie and Chinstrap overlapping. Body mass does the same. Bill length is the one panel where Adelie sits apart from the other two: Adelie bills average 38.8mm against 48.8mm for Chinstrap and 47.5mm for Gentoo. Bill length and flipper length carry complementary information, one isolating Adelie and the other isolating Gentoo. Pair them and you have split all three.
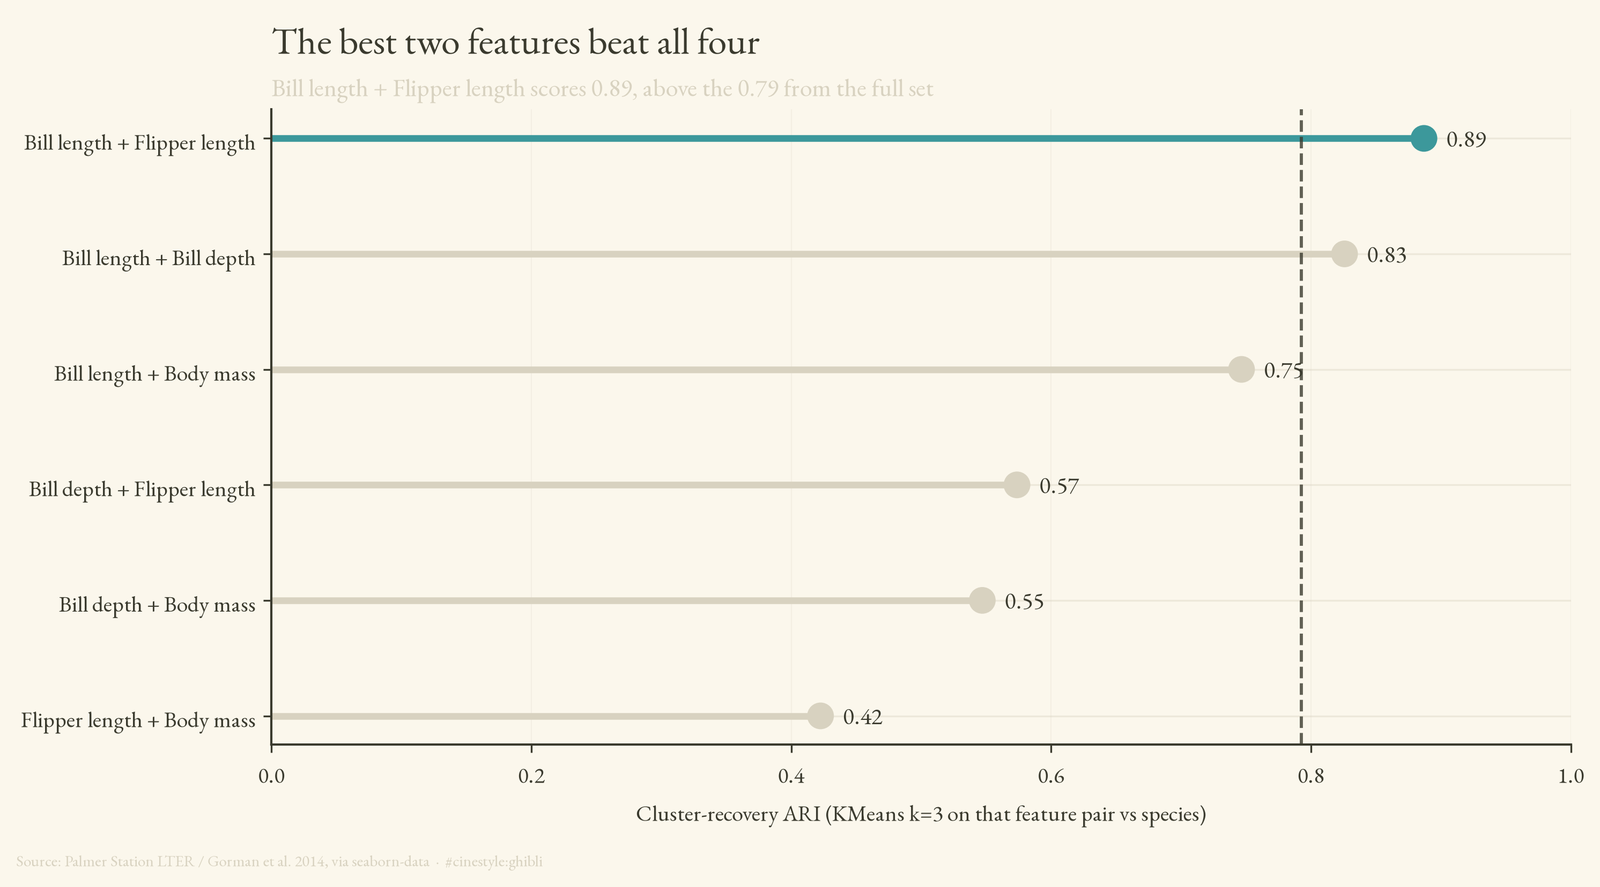
This is why two beats four. I tested every pair of features with the same standardize-then-KMeans recipe. Bill length plus flipper length scores 0.887. The worst pair, flipper length plus body mass, manages only 0.423, two features that both mostly point at Gentoo, so they agree with each other and stay blind to the Adelie versus Chinstrap line. Adding body mass and bill depth to the good pair does not add signal. It adds noise that nudges the centroids around. The all-four ARI of 0.793 is the price of that noise.
Where it actually breaks
The clustering recovers Gentoo perfectly. Every one of the 123 Gentoos lands in its own cluster, 100% recovery. The algorithm deserves no credit for that. Gentoos are bigger on nearly every axis, so they sit as an island in feature space and any method would find them.
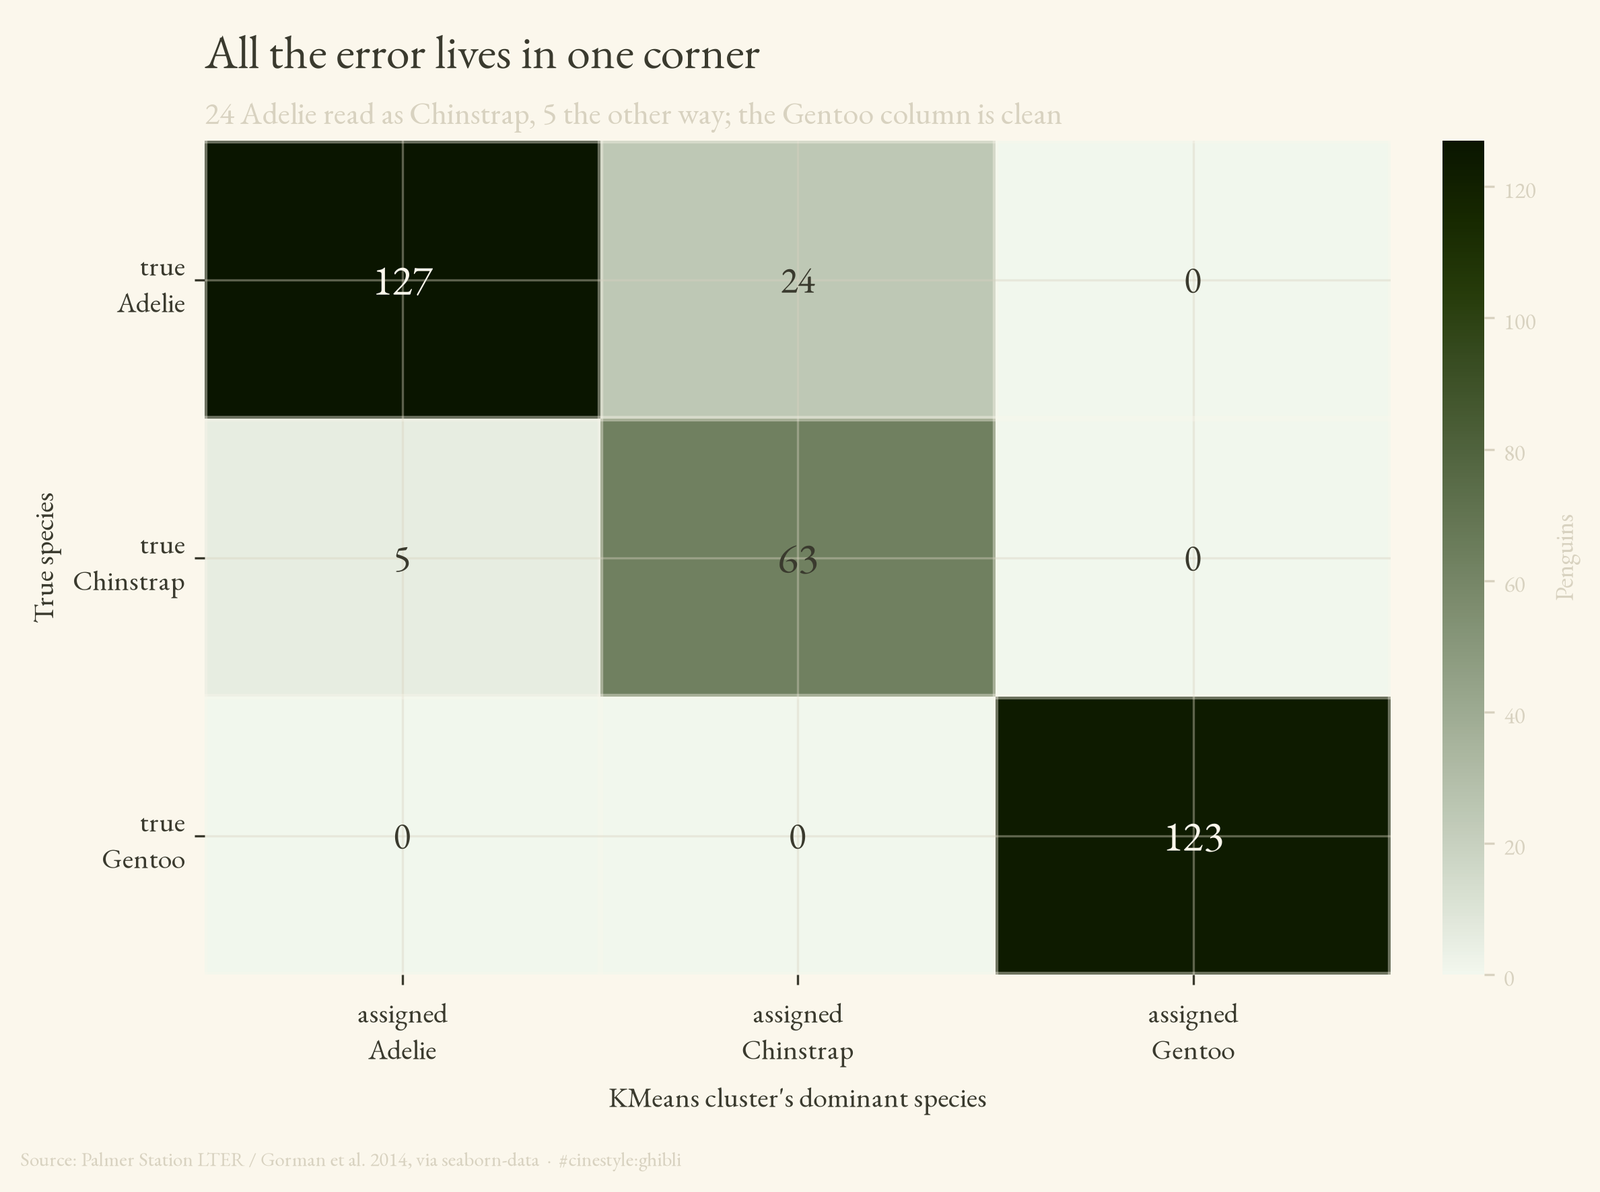
The real fight is Adelie versus Chinstrap, and the four-feature model loses chunks of it. Mapping each cluster to its dominant species, 91.5% of penguins end up in the “right” cluster overall. That average hides the split. Chinstrap recovers at 92.6%, Adelie only at 84.1%. The crosstab tells the story:
| assigned Adelie | assigned Chinstrap | assigned Gentoo | |
|---|---|---|---|
| Adelie | 127 | 24 | 0 |
| Chinstrap | 5 | 63 | 0 |
| Gentoo | 0 | 0 | 123 |
Twenty-four Adelies got filed as Chinstraps. Five Chinstraps got filed as Adelies. The Gentoo column is clean. The entire error budget is one fuzzy boundary between two similar-sized, similar-massed birds that differ mostly in the bill.
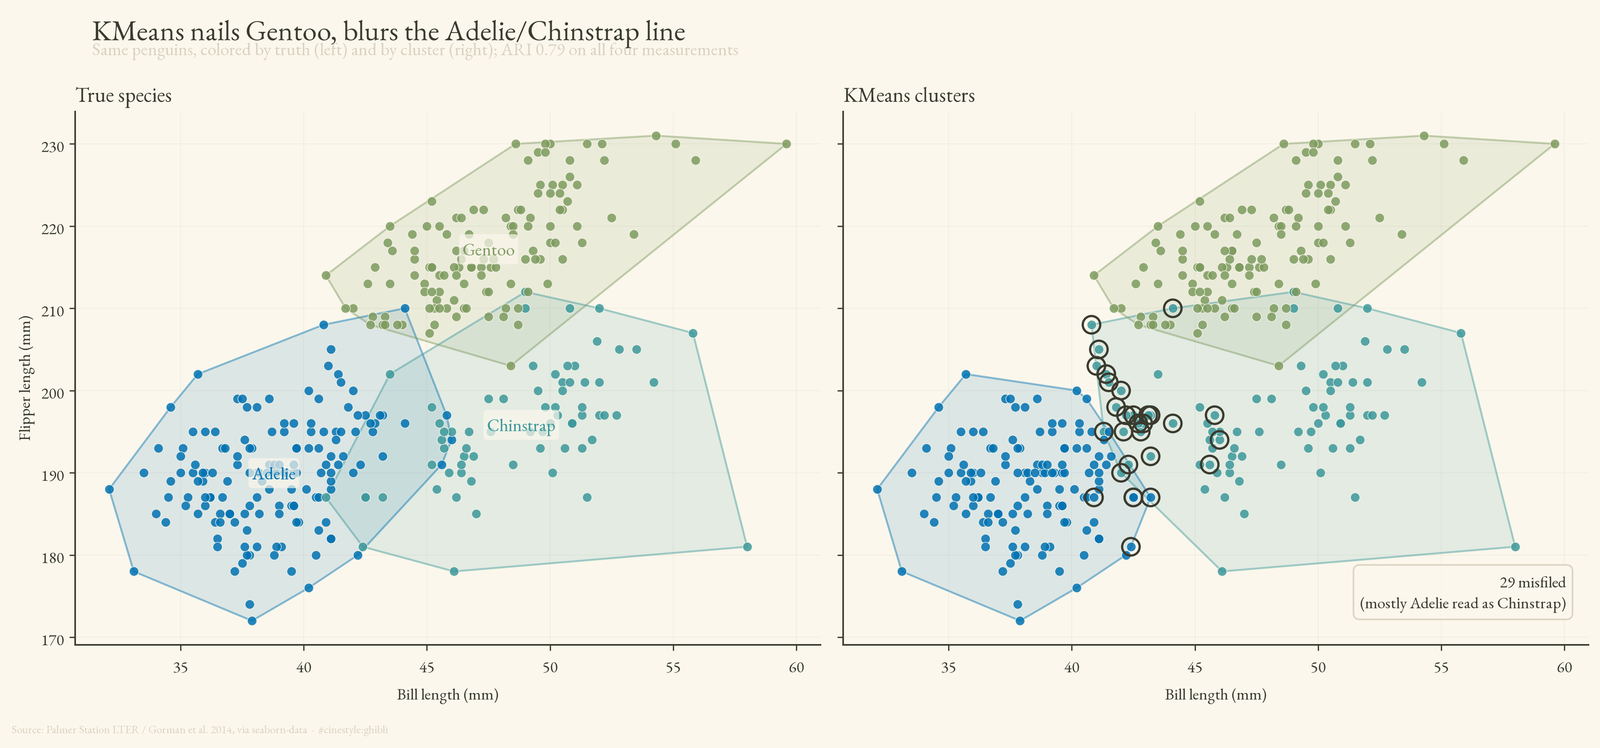
Put the truth and the clusters side by side in bill-length and flipper-length space and the boundary is right there. Adelie and Chinstrap form one elongated blob the two species share along the flipper axis and split along the bill axis. KMeans draws a straight cut through it, and a straight cut through an angled, overlapping cloud clips the corners. The 24 misfiled Adelies are the ones sitting closest to Chinstrap territory. A straight knife cannot carve a diagonal seam.
The caveat I will not paper over
I aligned clusters to species by majority vote: each cluster gets labeled with whichever true species shows up most in it. That is the standard move, and it flatters the score. It guarantees every cluster picks its best-case label, and with three well-sized clusters and one species (Gentoo) that is trivially separable, the mapping is never ambiguous here. On a messier dataset, or with more clusters than species, that majority-vote step can hide genuine confusion behind a tidy-looking number. ARI does not need the mapping and is the more honest figure. The 91.5% “accuracy” is the friendlier-looking cousin you should trust less.
Here is the lesson for anyone reaching for KMeans on their own data. More columns is not more signal. Two measurements that each isolate a different group beat four measurements where two of them point at the same easy split. I went in assuming the full feature set would win and the data corrected me, which is the whole reason to run the analysis instead of guessing.