// article
A Century of Medals
A century of Olympic medal power, and who traded the lead
The Olympic medal table is a leaderboard of nations that mostly stays the same and then, every few decades, does not. Across twenty-nine Summer Games, the United States has finished first more often than anyone, and it has never once been the only story. Behind the leader, the order churns: a superpower rises, a small state punches above its weight, a country that did not medal until 1984 climbs to second. The medal count is a record of who was strong, and exactly when.
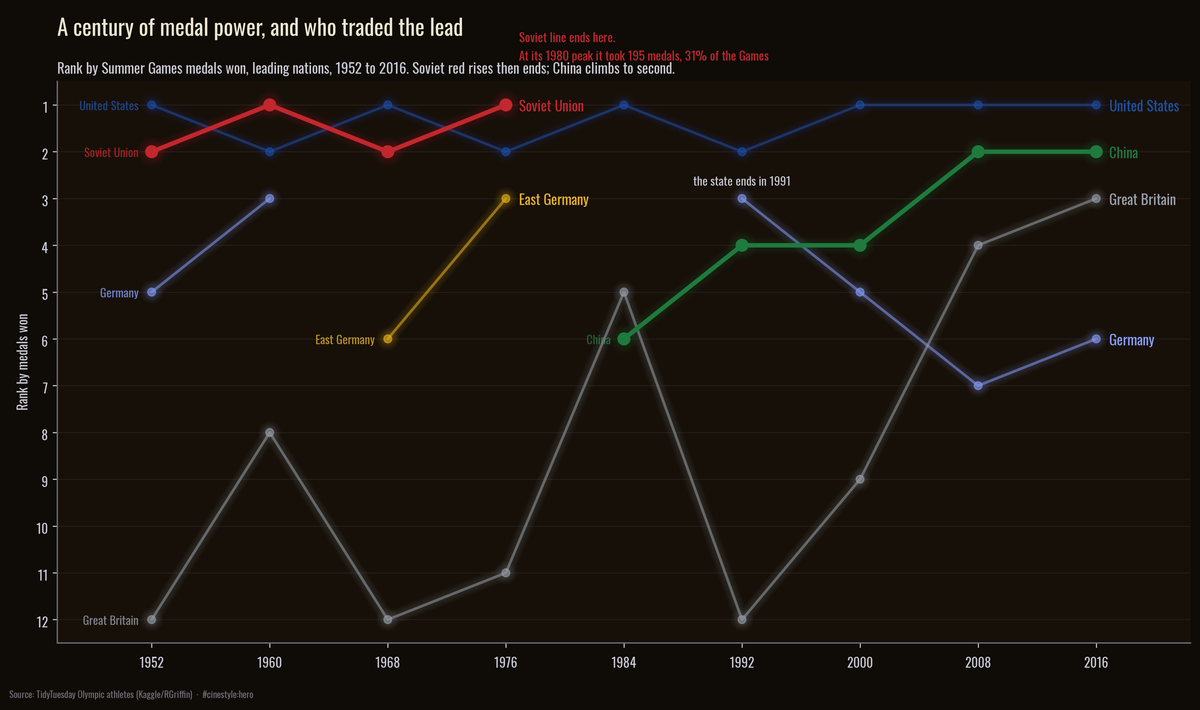
Each line above is one nation’s rank by medals won at a Summer Games. Rank one sits at the top. The American line barely moves. Everything interesting happens underneath it: the Soviet red line that ends mid-chart when the state did, and the Chinese green line that arrives late and climbs. Those two lines get their own sections below.
The data is the TidyTuesday Olympic record, 271,116 athlete-event rows from 1896 to 2016. One wrinkle matters before any count is trustworthy. A team that wins a gold shows up once per athlete, so a rowing eight is eight rows for one medal. I collapsed every medal to one row per Games, event, medal, and NOC, which drops the 39,783 athlete-medal rows to 18,905 actual medal events, a 52.5% cut. Every count below is medal events won, the number a medal table reports. This article is the Summer Games story; the 2,853 Winter medals sit out of it. Two boycotts also shape the table. The United States stayed home from Moscow in 1980, and the Soviet bloc stayed home from Los Angeles in 1984, so both years inflate the side that showed up. The US count of 173 in 1984 is its largest in the Games charted here.
The United States kept the lead and lost the share
Start with the constant. Across all Summer Games the United States has won 2,544 medals, against 1,005 for the second-place Soviet Union. That is a 2.53 times margin over the runner-up and 15.8% of every Summer medal ever awarded. No other nation is close.
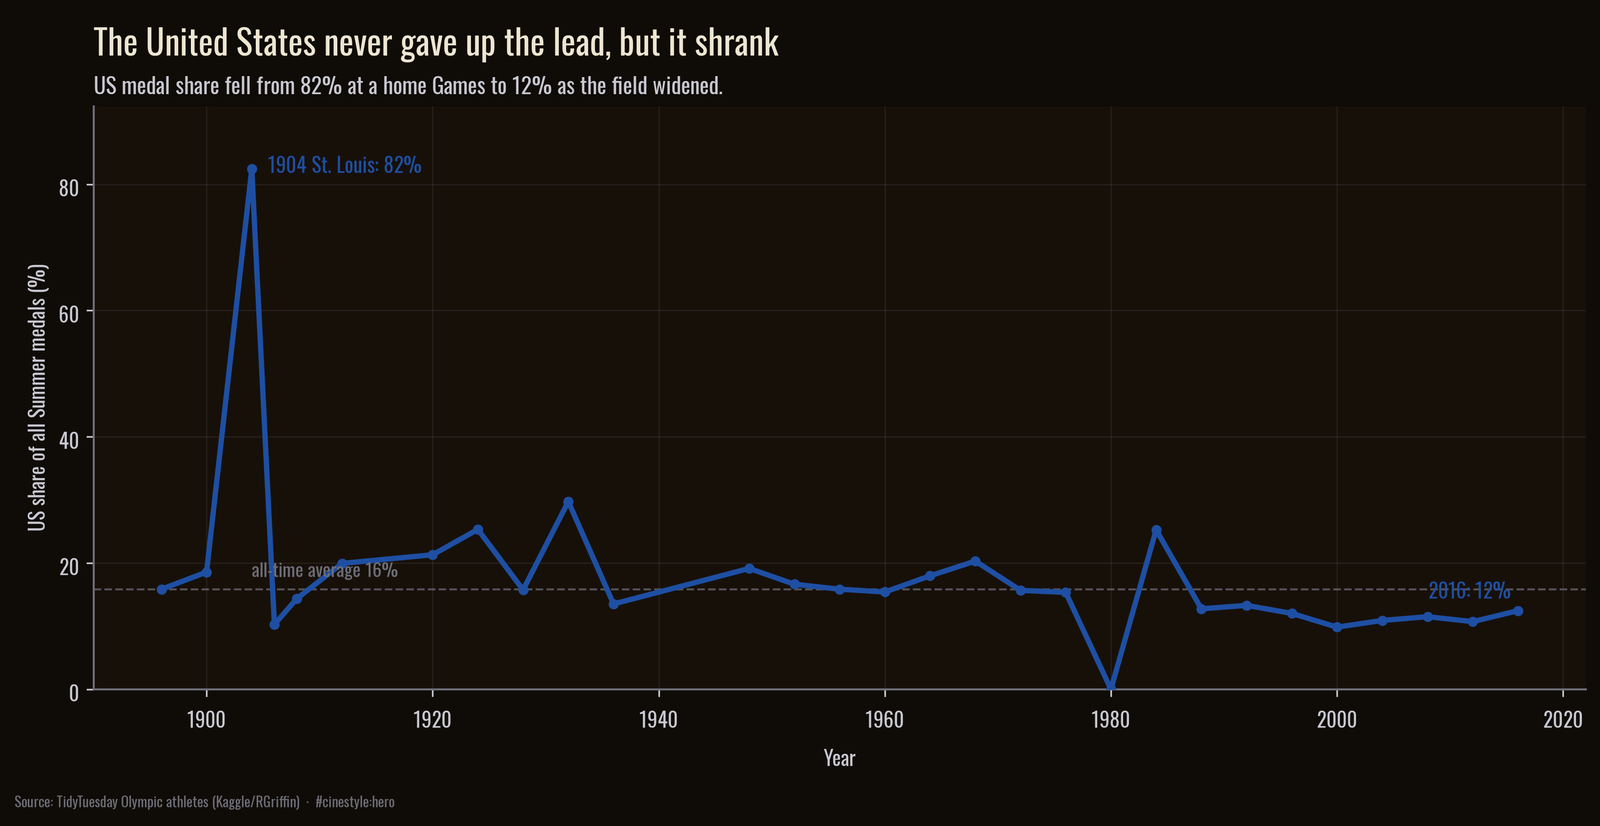
The share tells a story of decline, but not of weakness. In 1904 at St. Louis the Americans took 82.4% of the medals, because almost no one else crossed the ocean to a Games held in the American Midwest. That number is a story about who showed up, not who was best. By 2016 the US share was 12.4%, on 121 medals, the most of any nation that year. The picture is a pie that the host nation no longer owns: the United States still cuts the largest slice, and many more nations now reach for the rest. The United States kept first place while its share fell. Great Britain shows the crowding from below, climbing from 12th with 11 medals in 1952 to 3rd with 67 in 2016.
The Soviet Union rose, peaked, and vanished in one Games
The Soviets entered the Summer Games in 1952 and were second that year. At their 1980 home Games in Moscow, which the United States boycotted, they won 195 medals, 30.9% of everything awarded. Read the red line on the flagship: it trades rank one and two with the United States across four Games, then stops.
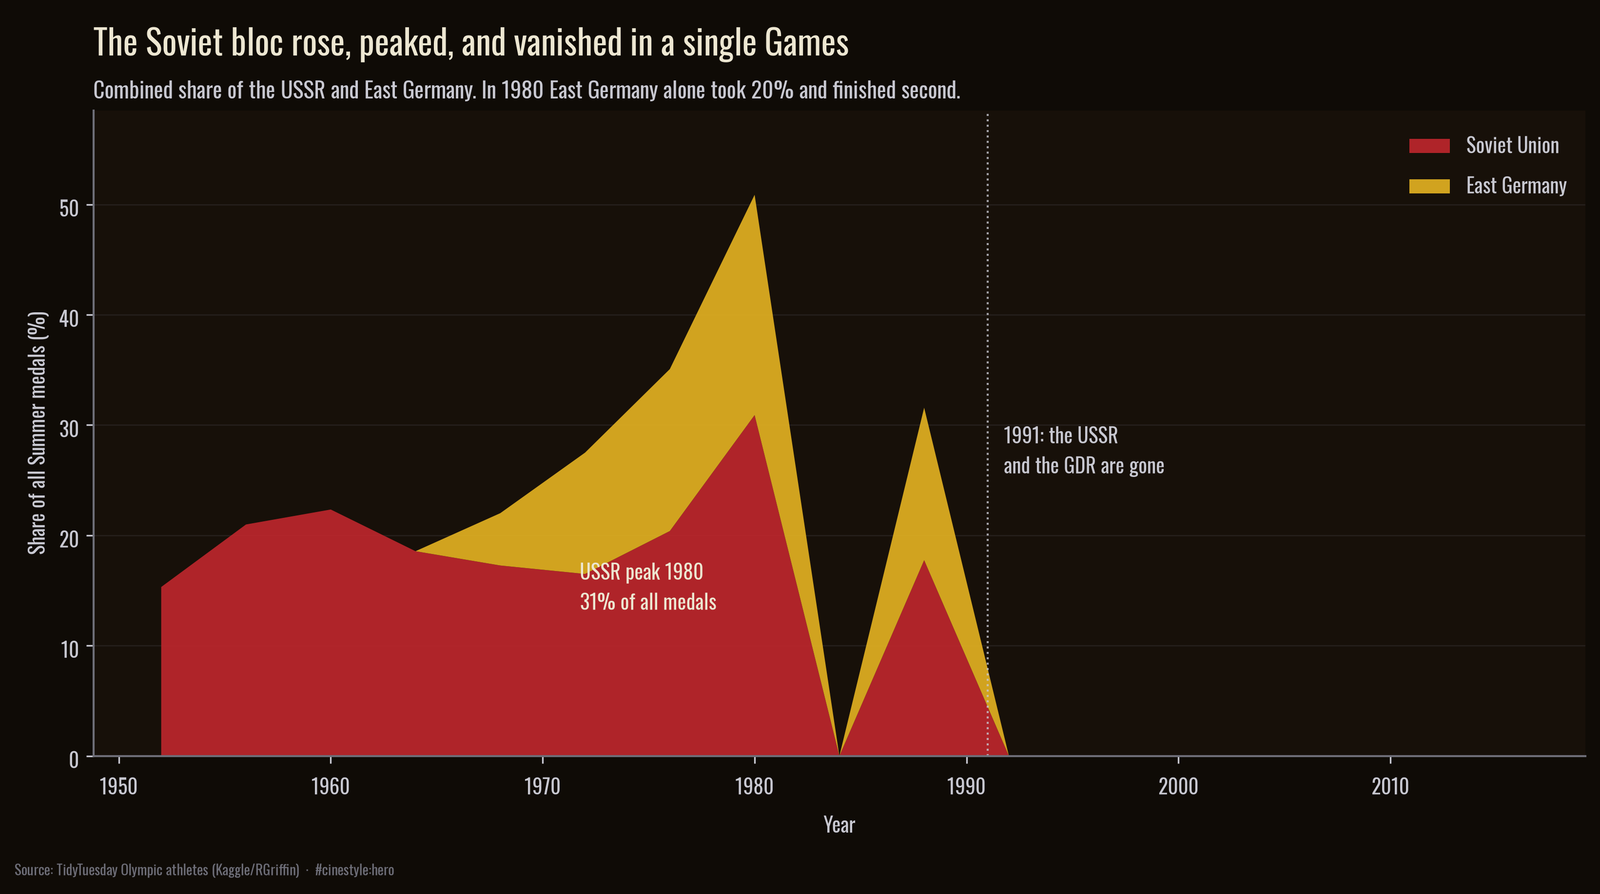
It stops because the country did. The Soviet Union dissolved in December 1991, and the next Games show the gap. In 1992 the former republics competed once as the Unified Team and won 112 medals, 13.8% of the Games, and then split into separate flags. Russia inherited the largest piece and won 56 medals in 2016, 5.8% of the table. The fair comparison is the last Soviet Games, Seoul 1988, where the USSR took 17.8%; Russia holds about a third of that. The Soviet line does not fade. It stops in 1991.
East Germany was the smallest giant
The stacked chart above hides a second nation inside the Soviet bloc. East Germany, a country of seventeen million people, took 126 medals in 1980, 20.0% of a Games the United States boycotted, and finished second behind the USSR. A country smaller than present-day Florida outscored every other nation on Earth except its patron.
That result did not come for free, and the honest footnote belongs here: East German sport ran a state doping program later documented in court, so the 1980 figure is a real medal count built on a record we now know was chemically assisted. The data cannot separate the training from the pharmacology. What it can show is the shape: a tiny state that briefly out-medaled the world, and then disappeared from the table at reunification in 1990.
China went from zero to second in twenty-four years
China won its first Summer medals in 1984, thirty-two of them. The line on the flagship starts there, at rank six, and reaches second by 2008.
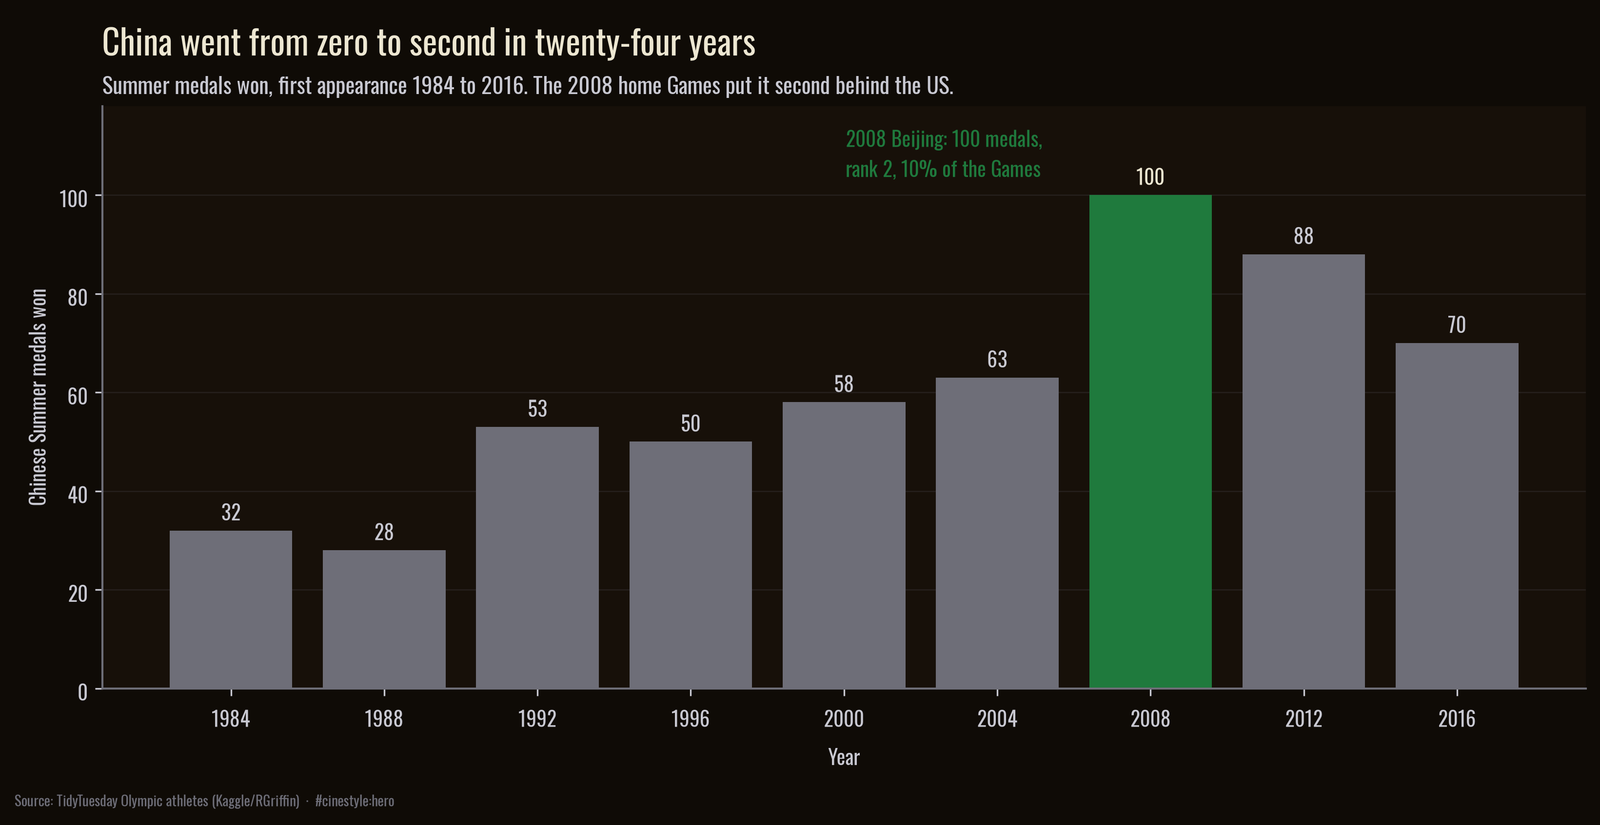
The peak is the home Games. In 2008 at Beijing, China won 100 medals, 10.4% of the table, and finished second behind only the United States. Run the arithmetic on the span: a nation that had zero Olympic medals before 1984 was the second sporting power on the planet twenty-four years later. The home-Games bump faded the way home-Games bumps do, and China settled to 70 medals in 2016, still comfortably in the top tier. The Soviets arrived at the top in their first Games. China took 24 years to get there, from a standing start.
What the table actually records
Strip the flags and the medal table is a hundred-year record of national projects. The American line is the steady one because the project was never about a single Games. The Soviet and East German lines are vertical and then absent because they were tied to states that wrote sport into policy and then stopped existing. The Chinese line is the new vertical. A medal table records where states funded sport, and for how long.