// article
Inside the Netflix Catalog
What is actually on Netflix: a catalog built in five years, made mostly of movies, and getting older
Netflix feels like a TV company, but its catalog is mostly film. Of the 7,787 titles in this early-2021 snapshot, 5,377 are movies and only 2,410 are TV shows. Movies are 69% of everything on the shelf. I expected the reverse, given how the brand talks about its series.
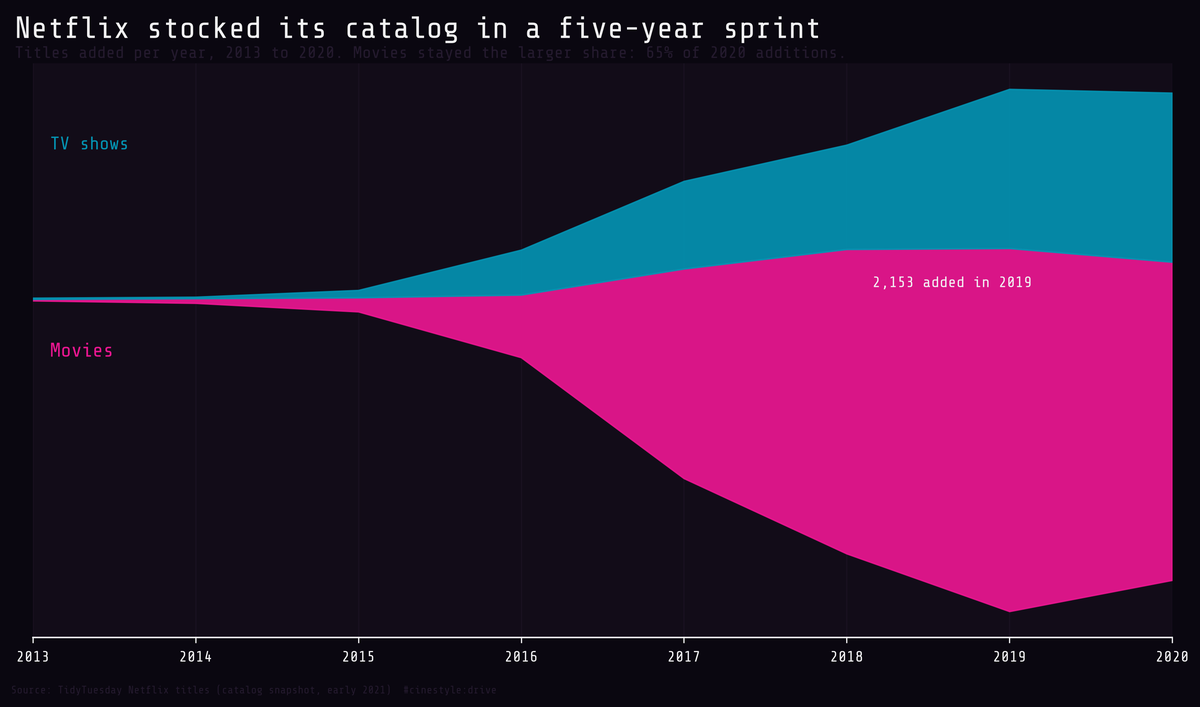
The stream above is the catalog being stocked. Each year’s slice is titles added that year, movies in pink below the line, TV in cyan above. Almost nothing was added before 2016, then the band swells for four years and crests at 2,153 additions in 2019. The whole library you browse today was loaded in a single five-year sprint.
The data is the TidyTuesday Netflix titles export, a snapshot of the catalog as it stood in early 2021. One row per title: type, country, the date it was added, its release year, its maturity rating, and its genres. Ten titles have no recorded add date, and 507 name no country. I kept those rows and excluded them only from the calculations they cannot support. Nothing here is imputed.
The mix is mostly movies, and it stayed that way
The obvious question for a streamgraph is whether the proportions shift. They barely do. In 2016, the first year with hundreds of additions and a real mix of both types, movies were 58% of what got added. In 2020 they were 65%. So as Netflix scaled up, it leaned slightly harder into film, not television.
The prestige series get the press, and the bulk buying is movies. If you picked a title at random off the shelf, you would pull a film two times out of three.
Where the catalog is made
Country is a messy field. A title can list several producing countries, comma-joined, and 507 titles list none. I split the multi-value entries and counted a co-production once for each country it names, so the totals below are title appearances, not unique titles. Most titles are simple: among the 7,280 that name any country, 84% name exactly one.
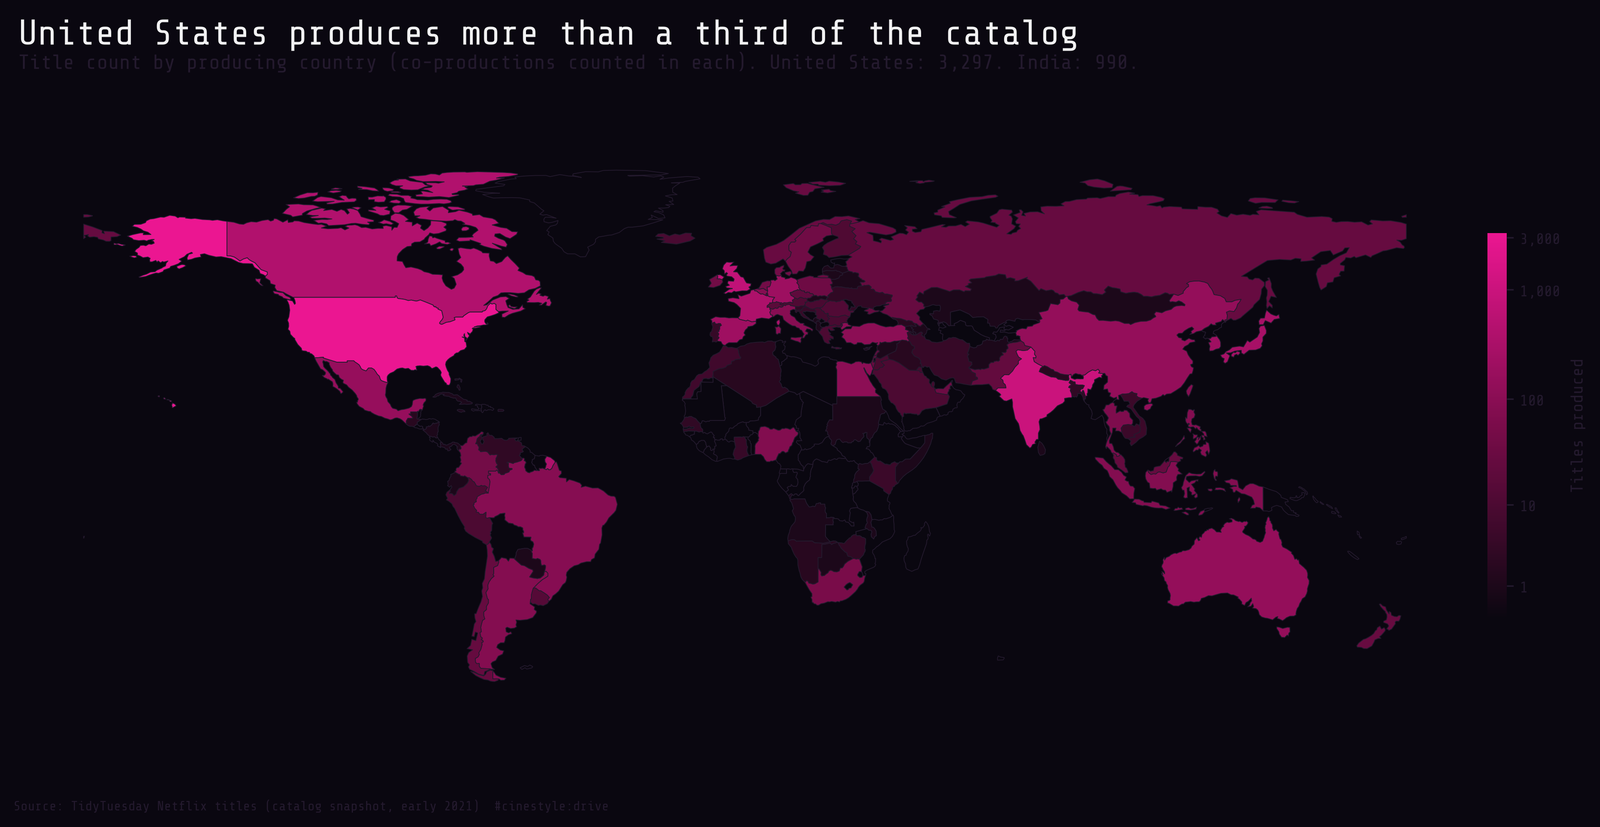
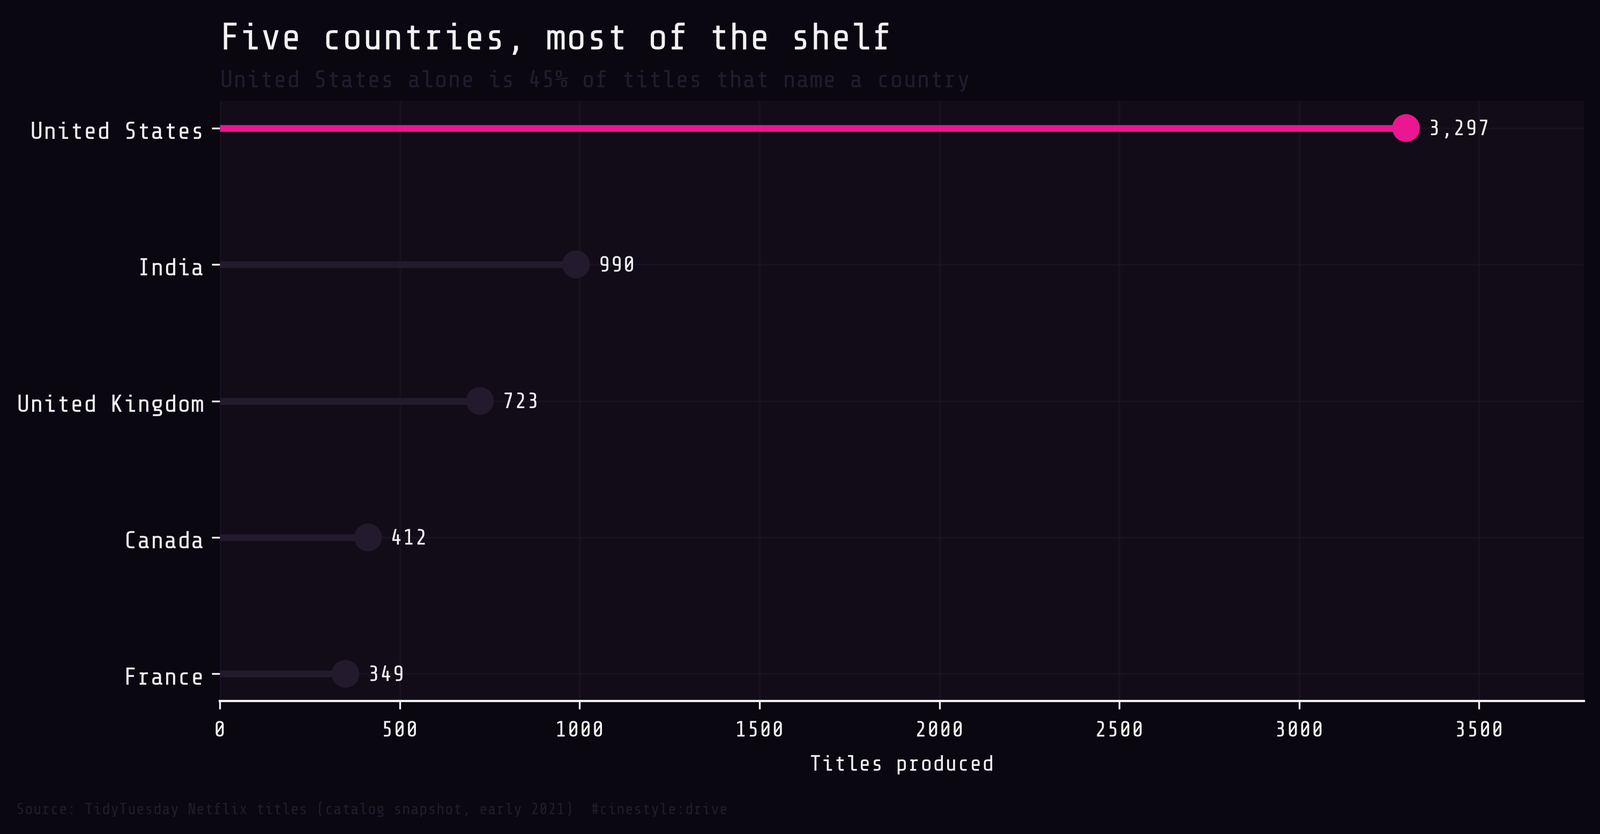
The United States produces 3,297 titles, 45% of everything that names a country. India is a distant second at 990, then the United Kingdom at 723. The map looks global, and the catalog does pull from 117 distinct countries. But five of them account for most of the shelf, and one of those five accounts for nearly half. The map also understates the long tail: it matched 104 of the 117 countries, so 13 small producers do not appear on it.
The catalog skews adult
Maturity ratings contradict a common assumption, that streaming catalogs are padded with kids’ content.
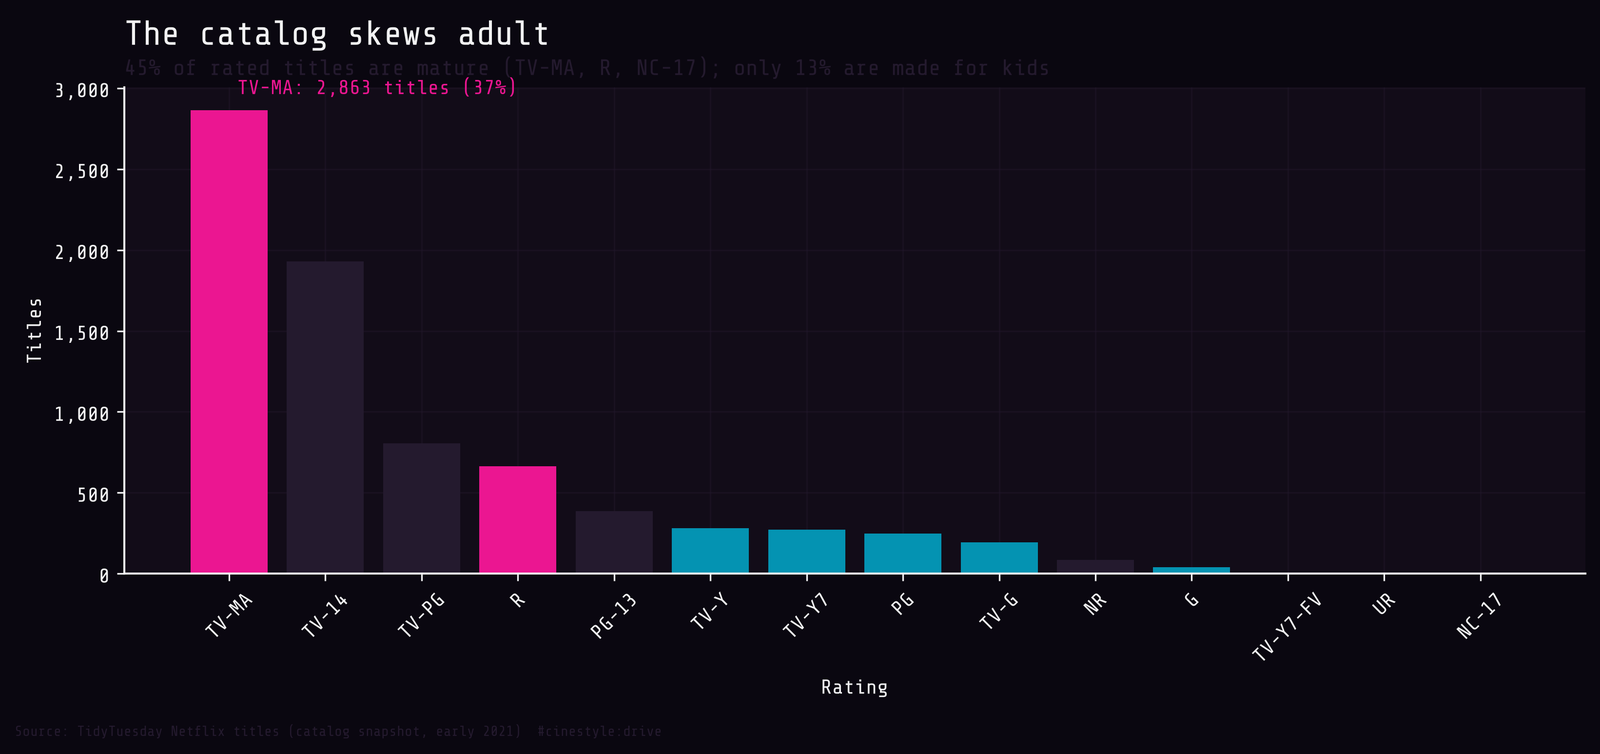
Of the 7,780 rated titles, 45% carry a mature rating (TV-MA, R, or NC-17). TV-MA alone is 2,863 titles, 37% of the rated catalog and the single largest bucket by a wide margin. Teen ratings add another 29.8%. Content made for children, the TV-Y through PG band, is 13%. The rated count includes 84 titles marked NR and 5 marked UR. The shelf is built for adults watching after the kids are asleep.
The catalog is getting older
The last question is whether what Netflix adds is fresh. To measure it I took the gap between a title’s release year and the year it was added, then asked what share of each year’s additions arrived within two years of release.
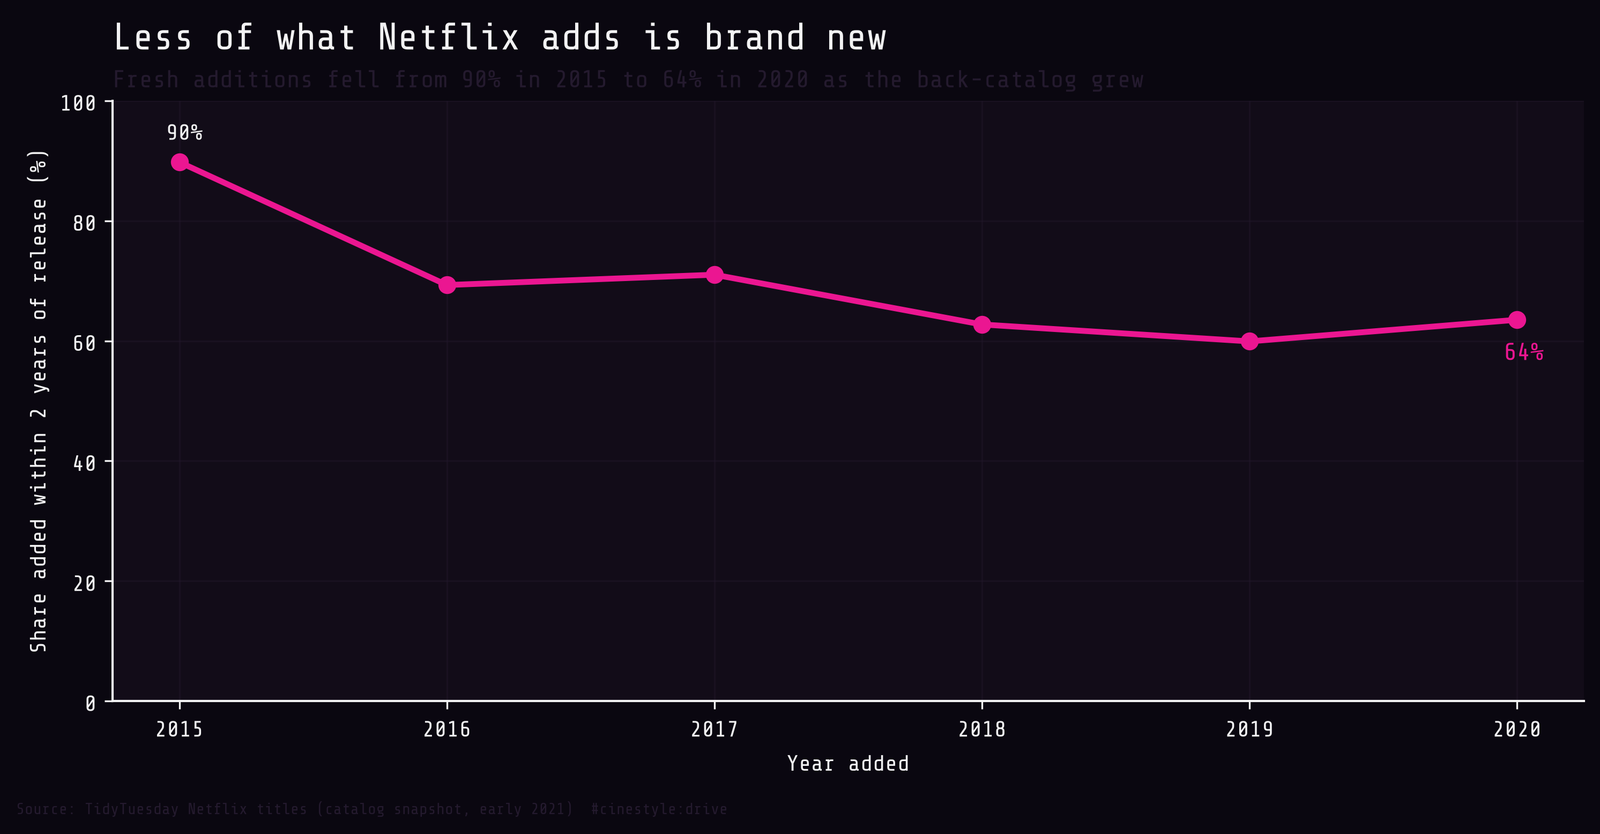
In 2015, 90% of additions were near-new. By 2020 that had fallen to 64%. The 2015 figure rests on only 88 additions, against 2,009 in 2020, so the early end of the line is the shakier one. The median lag across the whole catalog is still one year, so the typical title is recent, but the mean lag is 4.6 years, dragged up by a growing tail of older back-catalog acquisitions. As the library filled, Netflix stopped buying only the new releases and started buying the archive.
What the snapshot says
This is one export, frozen in early 2021, and the catalog has churned since. But within its own window the picture is consistent and the numbers all trace to one file. The shelf is two-thirds movies, nearly half American, mostly rated for adults, and slowly aging as the back-catalog grows. The data describes a mostly-film archive with an American center, not the home of new series the brand advertises.