// article
The Widow-Maker
Natural gas is the widow-maker, and the winter is where it earns the name
Traders call natural gas the widow-maker for a reason. Over the same window where Brent crude ran a 42% annualized volatility, Henry Hub gas ran 102%. That is the whole pitch in one line: the same barrel-of-energy logic, two and a half times the violence, and almost all of the violence lands between November and March. I went in expecting gas to be jumpier than oil. I did not expect the gap to be this wide, or the calendar to be this strict about when it shows up.
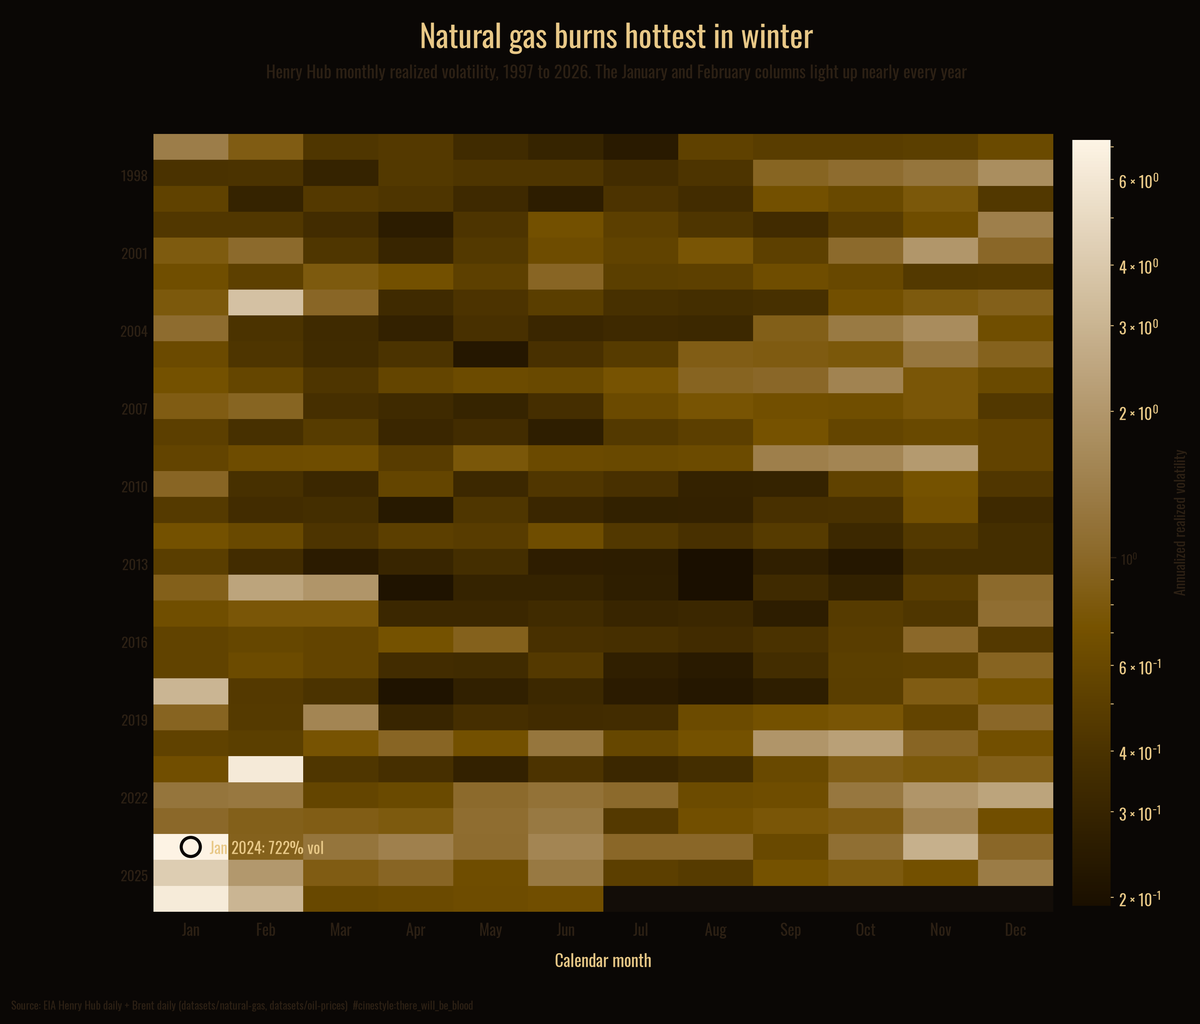
Each row above is one year. Each column is a calendar month, shaded by how volatile gas was that month. Read it top to bottom and the pattern never breaks: the left edge, January and February, burns bright almost every single year, and the middle of the year stays quiet. The brightest cell in the whole grid is January 2024, when realized volatility hit 722% annualized. That is not a typo. That is what a cold snap does to a fuel you cannot store your way out of.
The data is two daily price series: the EIA Henry Hub spot price, 7,388 trading days from January 1997 to June 2026, and Brent crude over the same span as the comparison. Both are clean. Date and price, nothing to wrangle. I work in log returns throughout, and I annualize volatility the standard way, daily standard deviation times the square root of 252.
Why gas and not oil
Oil is global. You can ship a barrel from anywhere to anywhere, and the world floats on a few months of inventory, so a shock in one place gets absorbed across the whole tanker fleet. Gas does not move like that. A molecule of gas in Louisiana is most of the way stranded from a buyer in Europe unless someone liquefies it, and that takes a terminal and a tanker and weeks. So gas prices are regional, and the region’s weather sets the demand.
That is the physical reason for the number. Annualized over the shared 1997 to 2026 window, gas volatility is 102% and Brent is 42%, a 2.4x gap.
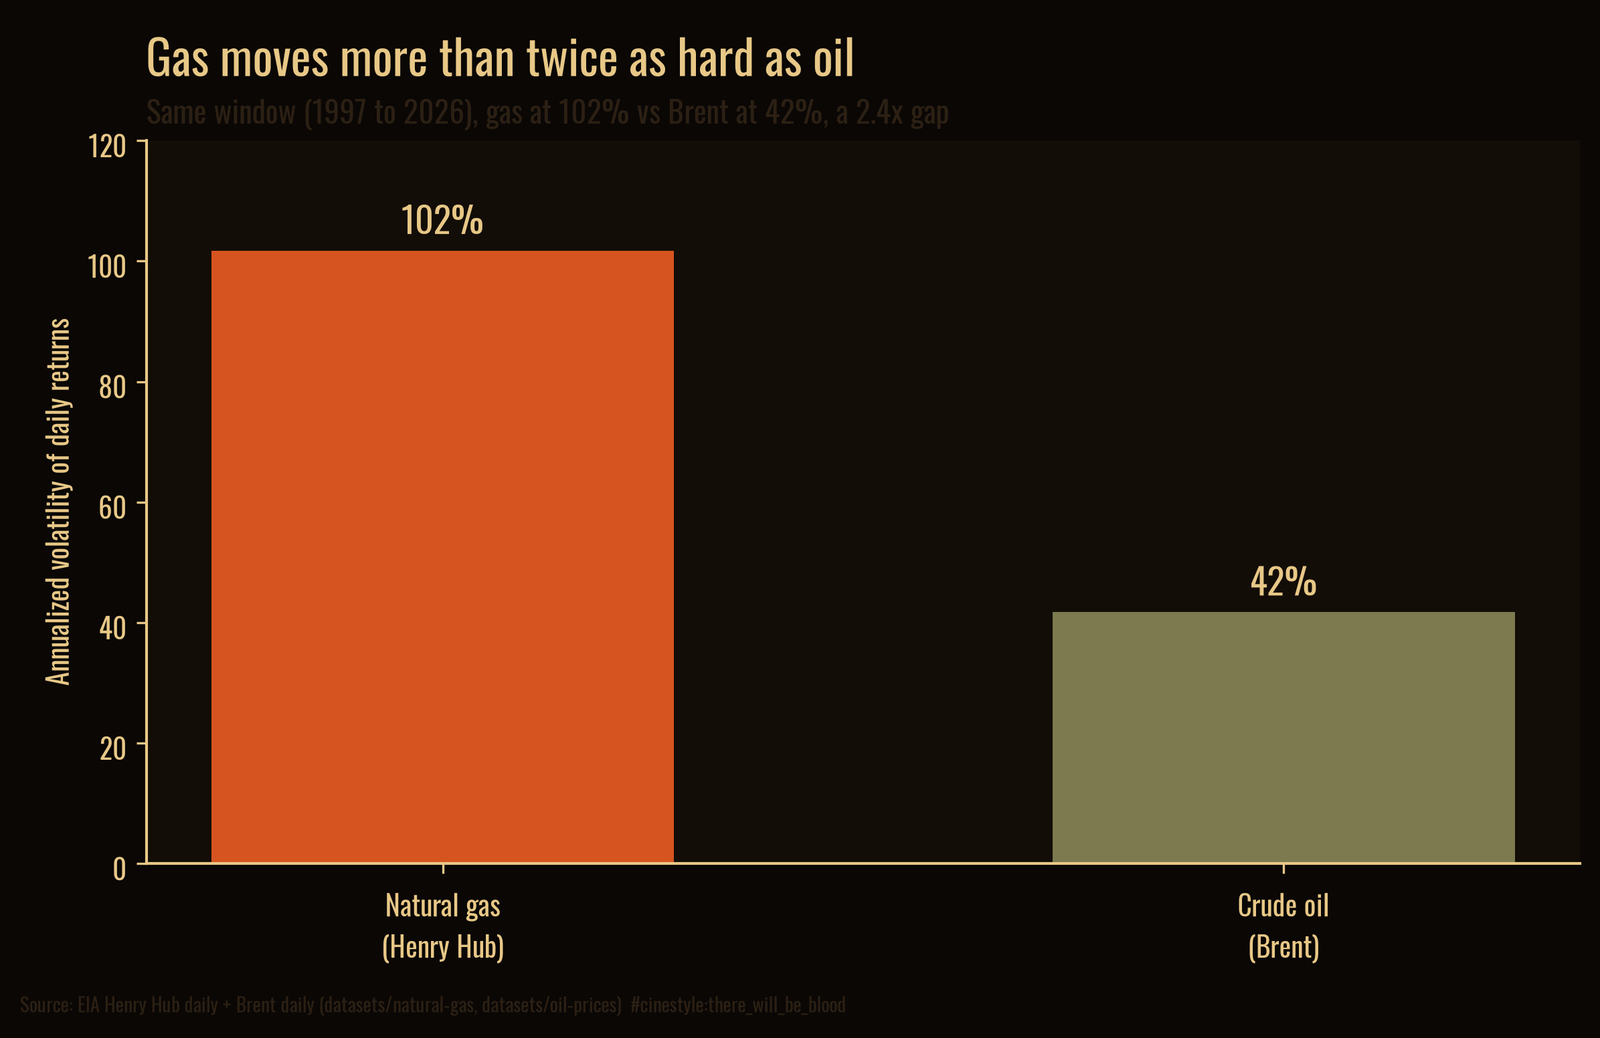
Both bars start at zero, so the heights are honest: gas really is about two and a half times as wild as oil, not a cropped-axis illusion. When someone tells you energy is a volatile asset class, ask which energy. Oil is volatile. Gas is a different animal.
The calendar does most of the work
Split the year into the heating season, November through March, and everything else. Gas volatility in the heating months runs 138% annualized. The rest of the year it runs 65%. The cold half of the calendar is more than twice as dangerous as the warm half, a 2.1x gap inside the same commodity.
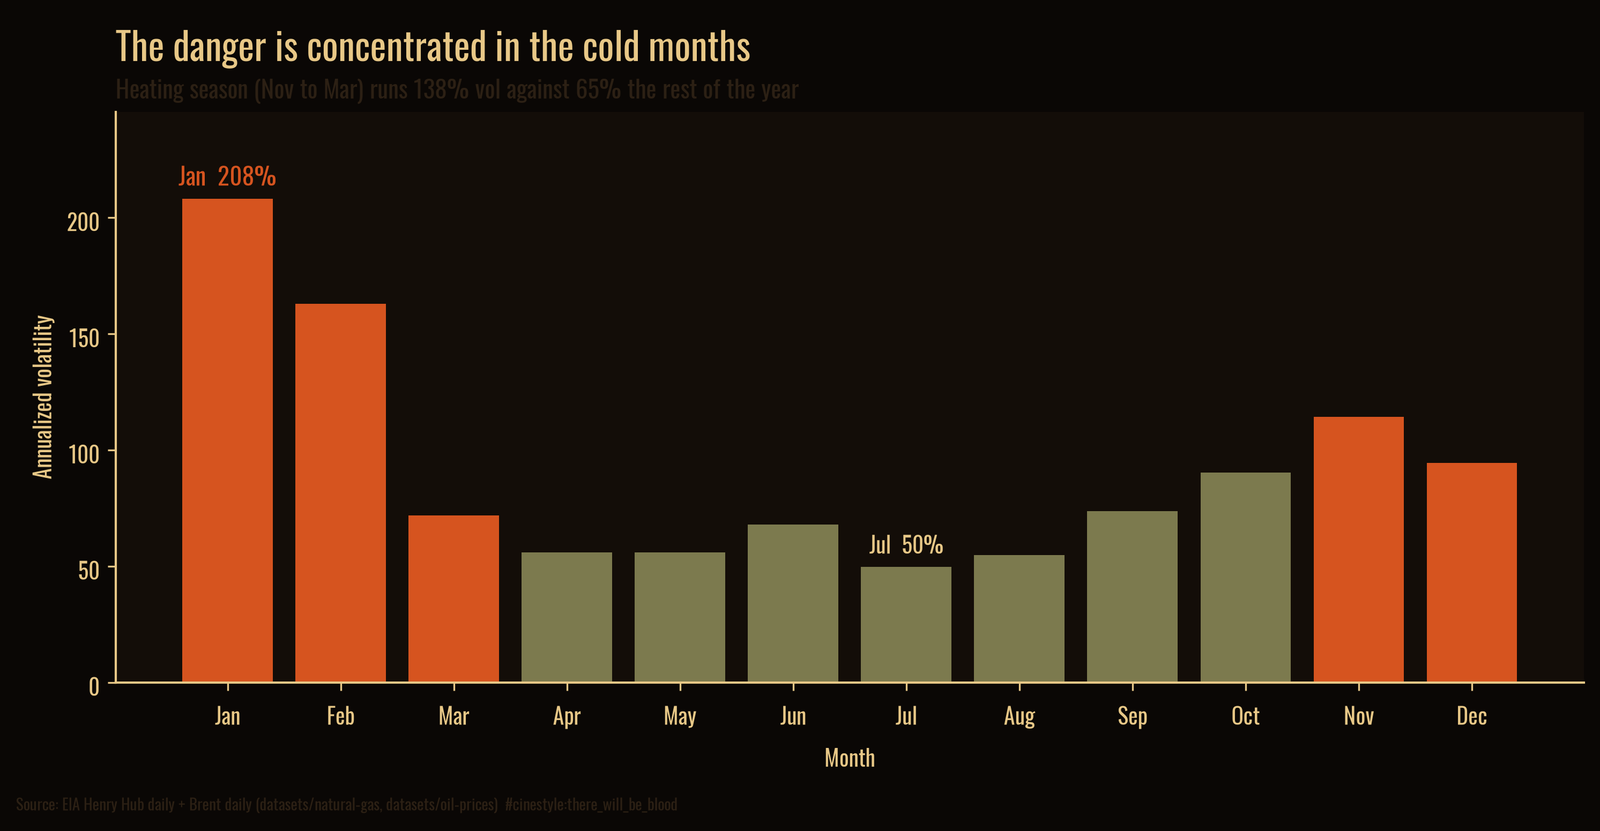
Pool every January in the record and you get 208% annualized volatility. Pool every July and you get 50%. Here is the picture worth holding onto. Gas demand is a thermostat. In summer the thermostat barely moves, so price barely moves. In a January cold snap, fifty million furnaces switch on inside the same week, against a pipeline network that cannot deliver more than it was built to deliver, and the price has to do all the rationing by itself. The volatility is not random. It is the sound of a system with no slack hitting a demand spike. Summer gas is boring because nothing is asking the grid for anything it cannot give.
The spikes that made the name
The averages hide the real story, which is that the damage comes in a few violent days. The single largest one-day move in the record is January 12, 2024, a 143% log return as Henry Hub jumped from $3.15 to $13.20 on an Arctic outbreak. The very next trading day, January 16, it gave it all back, a 140% log return in the other direction down to $3.25. Up fourfold, then down by three quarters, in two sessions. A position held through that weekend is how the widow gets made.
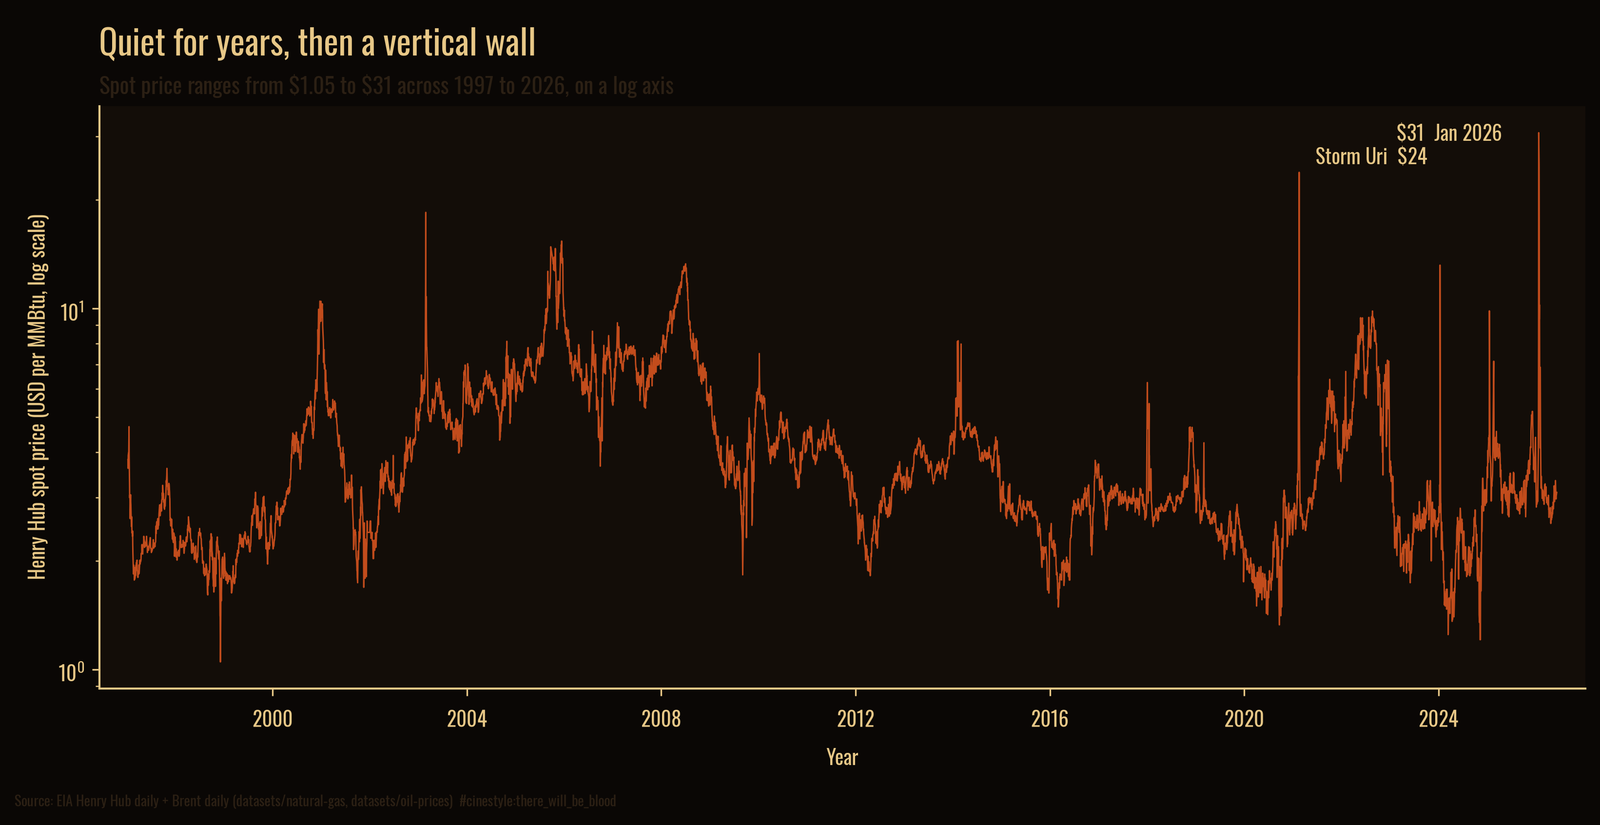
February 2021 is the famous one. Winter Storm Uri froze Texas wellheads at the exact moment the state’s heating demand peaked, supply and demand moving the wrong way at once. Henry Hub went from $2.66 to $23.86 inside that single month, a roughly 9x move, while pipelines literally froze. The all-time record on this series is higher still, $30.72 in January 2026, against a floor of $1.05 set back in December 1998. Same instrument, same units, a 29x spread between the calmest day and the wildest.
Look at the price chart on a log axis and the shape is unmistakable. Long stretches of nothing, then a wall. The market spends years asleep and pays for it in a week.
The caveat I owe you
This is spot price, not the front-month futures most traders actually hold, and spot is the jumpier of the two because it cannot be hedged forward. So the raw widow-maker numbers here overstate what a futures book would feel, and the 722% January 2024 reading in particular is a spot artifact of a few violent days, not a month of steady extreme weather. The seasonal structure is the finding that survives the method choice. The exact peak heights are spot-specific. I also annualize with a flat 252-day convention, which inflates the headline percentages relative to a calendar-day basis, but it inflates gas and oil identically, so the 2.4x ratio between them holds either way.
I came to this expecting gas to be a rowdier version of oil. It is not. It is a seasonal animal that sleeps three quarters of the year and tries to kill you in January. The annual average is the wrong number to look at. The calendar is the number that matters, and the calendar says the same thing every winter.