// article
The Moving-Average Rule
The moving-average rule halves the worst crash, and in this backtest it also edged the market
Most market-timing schemes are noise dressed as discipline. The 10-month moving-average rule is the rare one that holds up under 152 years of data, and it holds up for a reason that has nothing to do with predicting returns. It does not call tops. It exits after a trend breaks, so it avoids riding the whole way down. Across Robert Shiller’s monthly S&P 500 record from 1871 to 2023, that one habit cut the worst drawdown roughly in half, trimmed a third off the volatility, and gave up no return; on the numbers it added a little.
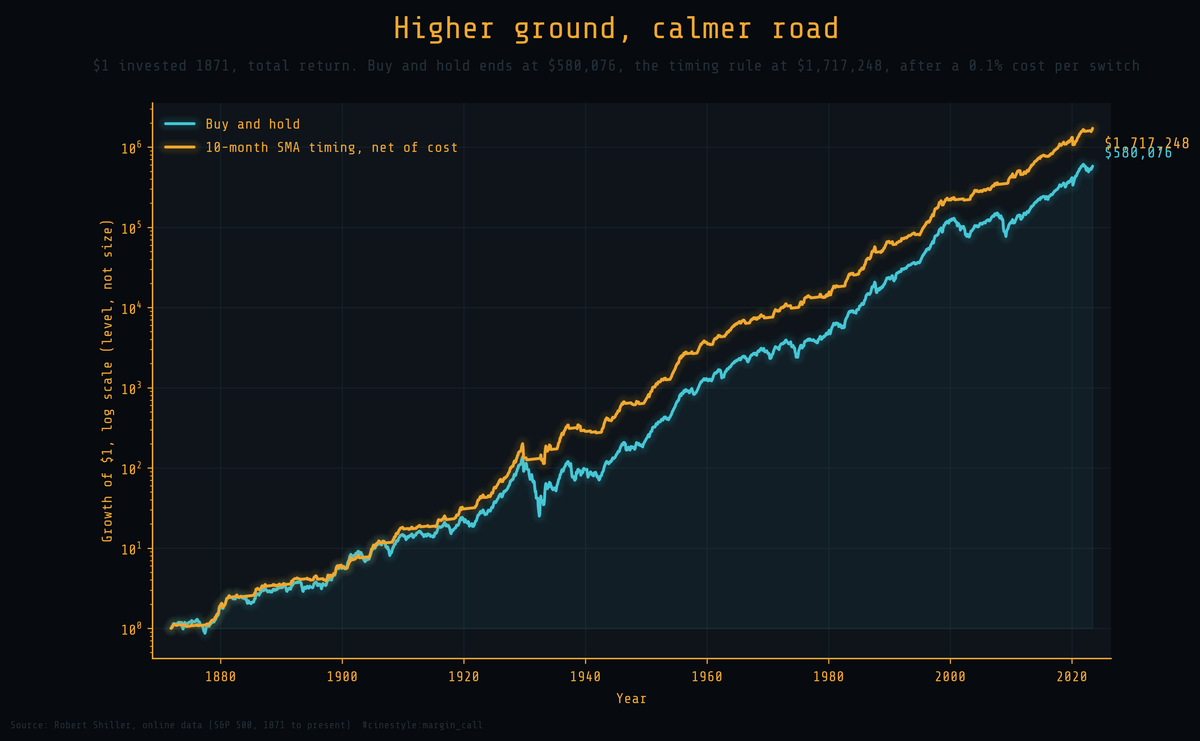
A dollar invested in 1871 and simply held grew to about 580,000 in total-return terms. The same dollar run through the timing rule, net of trading cost, grew to about 1.7 million. The y-axis is a log scale, so it reads as a level, not a size: equal vertical steps are equal multiples, not equal dollars. What the eye should catch is not the gap in height but the difference in texture. The timing line is smoother because it skips the worst declines.
The rule, stated plainly
The rule is the one Mebane Faber popularized, and it fits in a sentence. At each month’s close, compare the price to its trailing 10-month simple moving average. If price is at or above the average, hold stocks next month. If it is below, hold cash. The rule uses no earnings, forecasts, or discretion.
I built returns as total returns, not price changes. Each month earns the price move plus one twelfth of the trailing annual dividend, reinvested at the prior price, which is the standard way to compound the Shiller series. When the rule sits in cash I credit a flat 2 percent annual yield, a deliberately modest stand-in for short-term rates. Trading is not free, so I deduct one tenth of one percent from the month’s return every time the rule switches sides. A full exit and re-entry therefore costs about two tenths of a percent, round trip. I state the cost assumption because it changes the verdict at the margin.
The signal fires on last month’s close to govern this month’s return, so there is no peeking at a price the investor could not have seen. The test runs from December 1871 to June 2023, which is where the dividend and price-index inputs run dry in the feed. That is 1,819 months. I did not invent the missing fundamentals.
What it actually buys you
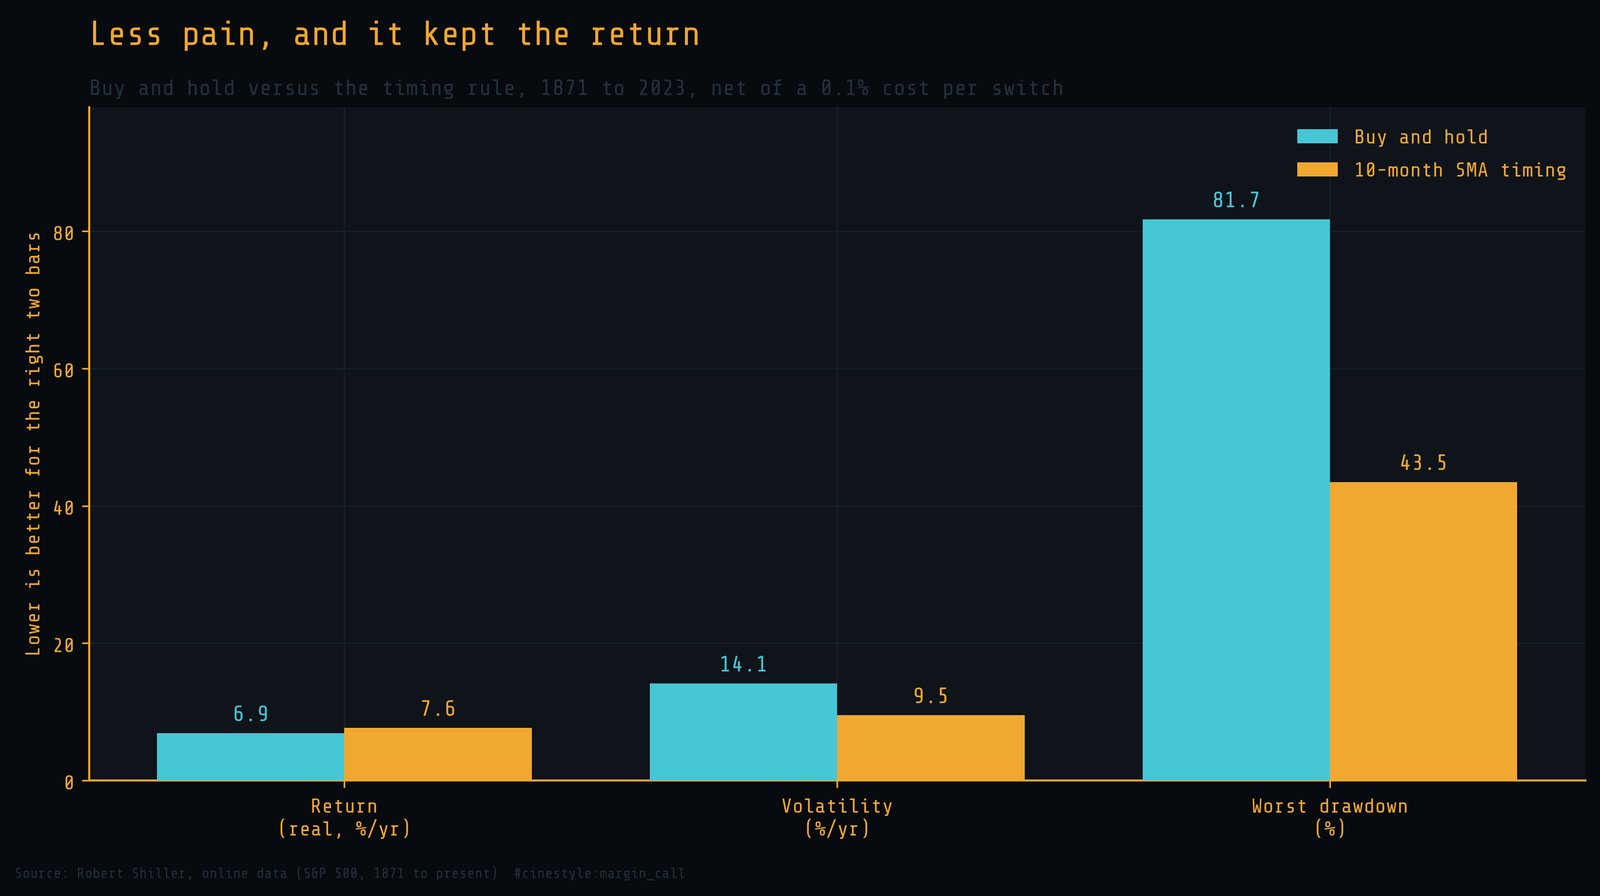
Three numbers carry the case. In real, inflation-adjusted terms the rule returned 7.6 percent a year against buy-and-hold’s 6.9 percent, so it gave up nothing in return and in fact added a little. That small edge leans on the cash assumption. The rule sits in cash 37 percent of the time, and a 2 percent yield over those months is worth about 0.73 points a year, close to the rule’s whole 0.78-point nominal edge. The return win rests on that assumption. The halved drawdown does not. Volatility fell from 14.1 percent a year to 9.5 percent. The worst peak-to-trough loss shrank from 81.7 percent to 43.5 percent. That last number is the whole product. Buy-and-hold investors who lived through 1929 to 1932 watched four out of five dollars evaporate. The rule got them out partway down and held them out, and the deepest hole it ever dug was a little under half.
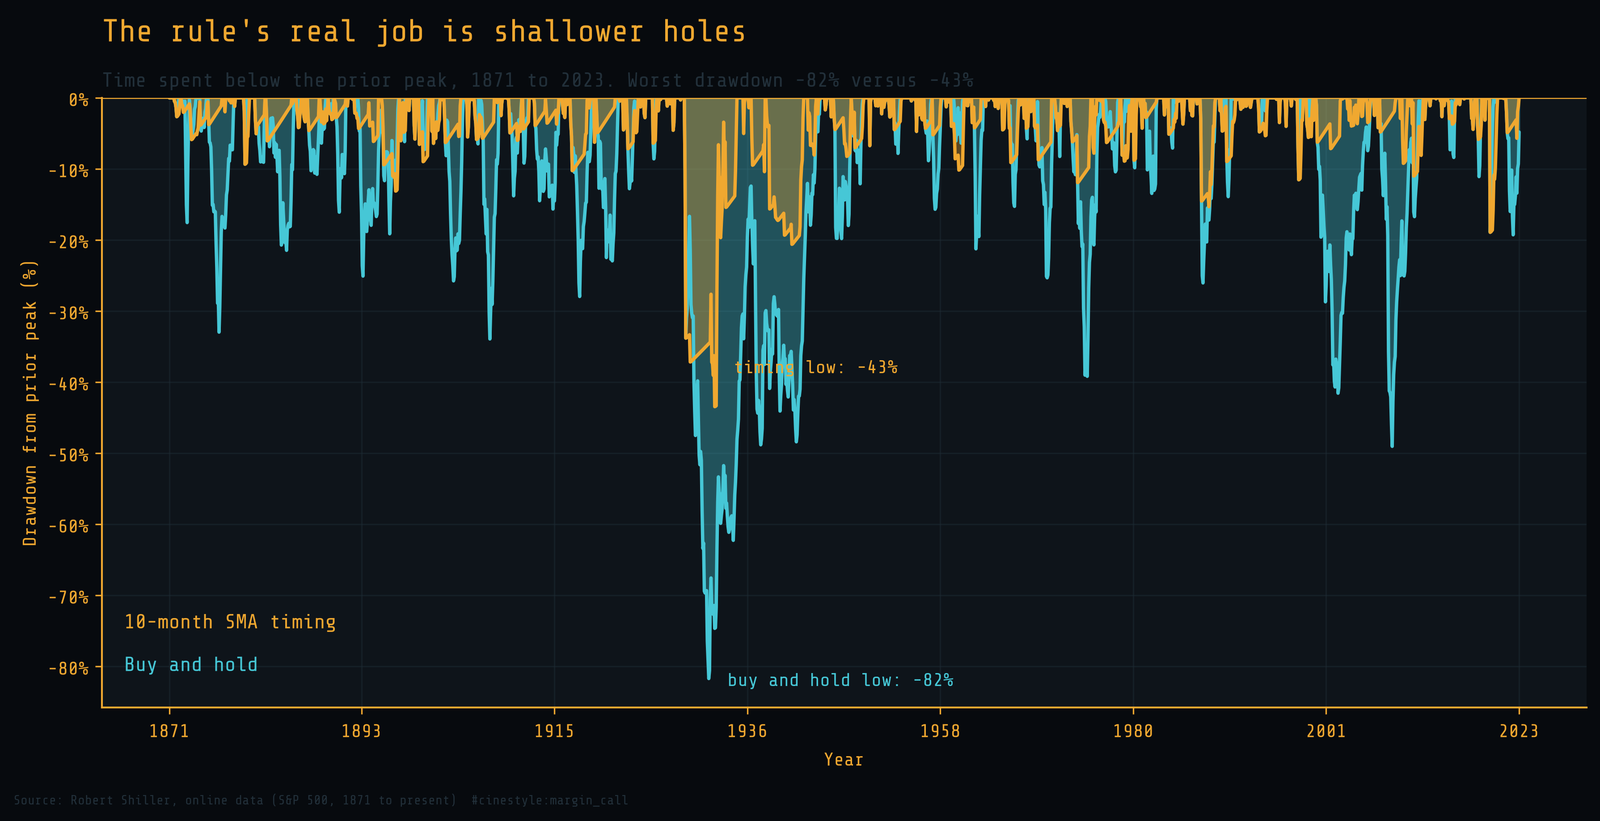
The underwater chart is the honest picture an equity curve hides. Both lines sit at zero whenever the strategy makes a new high and dip below the rest of the time. Buy-and-hold spends long stretches deep underwater: the 1930s, the 1970s, the dot-com bust, 2008. The rule, in amber, stays shallower almost everywhere, and in the two genuine catastrophes, the early 1930s and the 2008 crash, the difference is enormous. A strategy that spends less time underwater is one a real human can actually hold without capitulating at the bottom. That decides whether an investor keeps following the plan.
The whipsaw tax
The brochures skip this part: the rule is wrong most of the time it acts. It switched sides 207 times over the century and a half, and it spent 63 percent of all months invested and the rest in cash. Of every stretch it spent out of the market, 70 percent would have been better spent invested. The rule sells, the market dips a little or not at all, then recovers, and the rule buys back higher. That is a whipsaw, and it happens far more often than the rare clean exit before a crash.
So how does a rule that is wrong 7 times out of 10 still win? Of its 104 exits, 31 were worth making, and those include the 1930s and 2008. A whipsaw costs a fraction of a percent and a few months of lagging a rising market. Dodging 1931 or 2008 saves half your capital. The trades are not symmetric. You lose small and often, and you win rarely and huge, and over 152 years the huge wins more than pay for the steady bleed. The cost of all that trading, by the way, came to 0.15 percent a year. The whipsaws hurt through opportunity, not commissions.
Where it helps and where it hurts
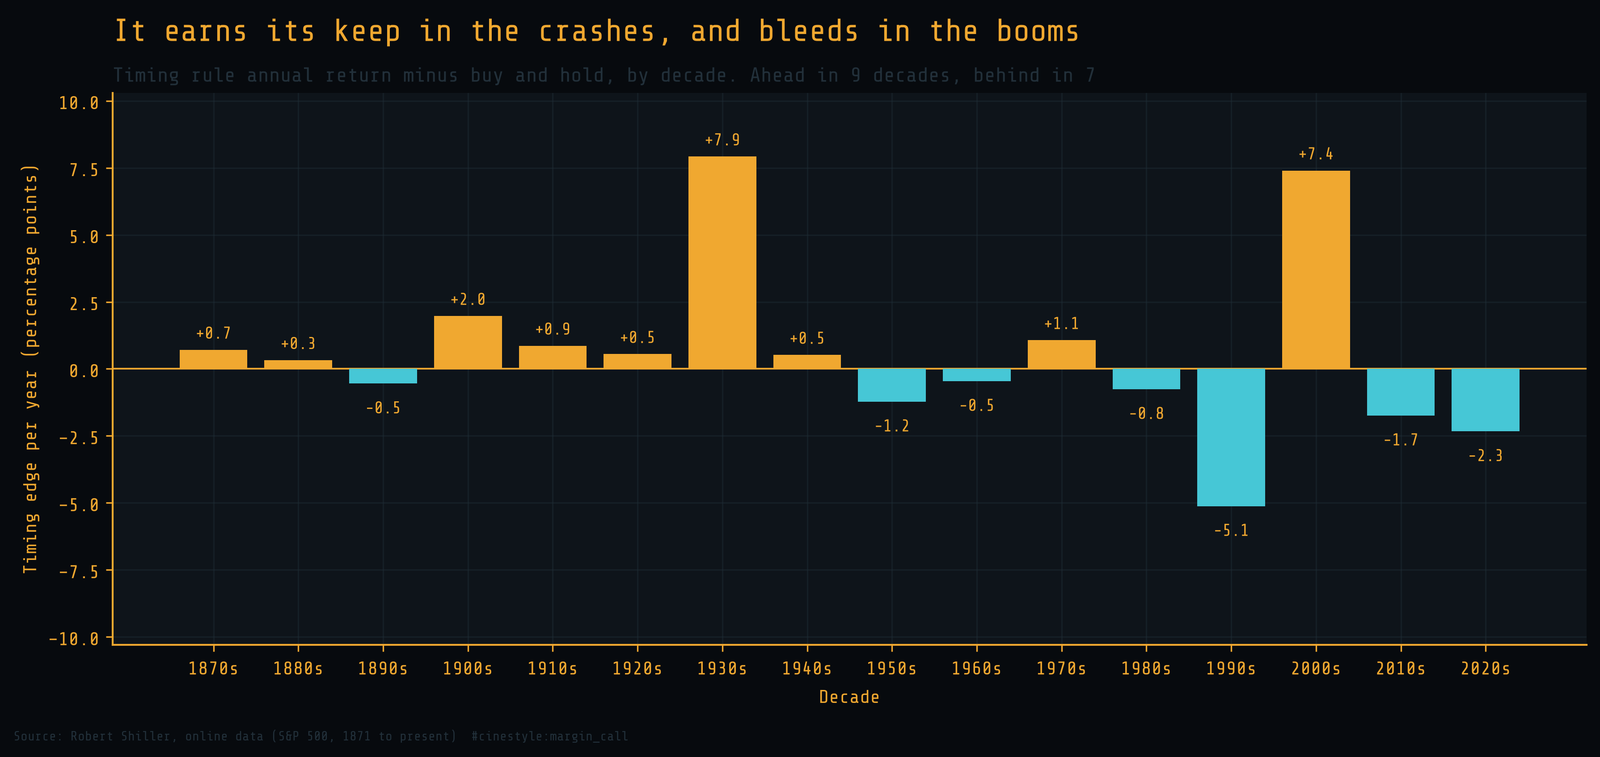
Split the record by decade and the pattern is stark. The rule’s two best decades by a wide margin are the 1930s, ahead 7.9 points a year, and the 2000s, ahead 7.4 points a year. Those are the two decades that contained the two worst crashes in the data. Its worst decade is the 1990s, behind 5.1 points a year, the most relentless bull market in living memory, where every dip the rule respected turned out to be nothing and every exit cost it upside. The 2010s and 2020s have also gone to buy-and-hold. Ahead in 9 decades, behind in 7.
That is the trade laid bare. The rule earns its keep in the crashes and bleeds in the booms. If the future is one long boom with no real crash, it will lag, and you will feel foolish holding cash while the index runs. If the future contains another 1929 or another 2008, it will save you from the loss that ends portfolios. Nobody knows which future is coming, which is exactly why an insurance policy that has historically paid for itself is worth holding.
The honest verdict
Does the moving-average rule protect you? Yes, and the protection is close to free. Over the full record it raised real return slightly, cut volatility by a third, and halved the worst loss, after costs. The catch is temperament. You will be whipsawed most of the time you act, you will trail in long bull markets, and you will have to keep following a rule that looks dumb for years at a stretch. The rule does not need you to be right about the market. It needs you to be more patient than the market is cruel. Over 152 years, patience won.