// article
Jobs That Switched Gender
The job that went from all-male to 96% female
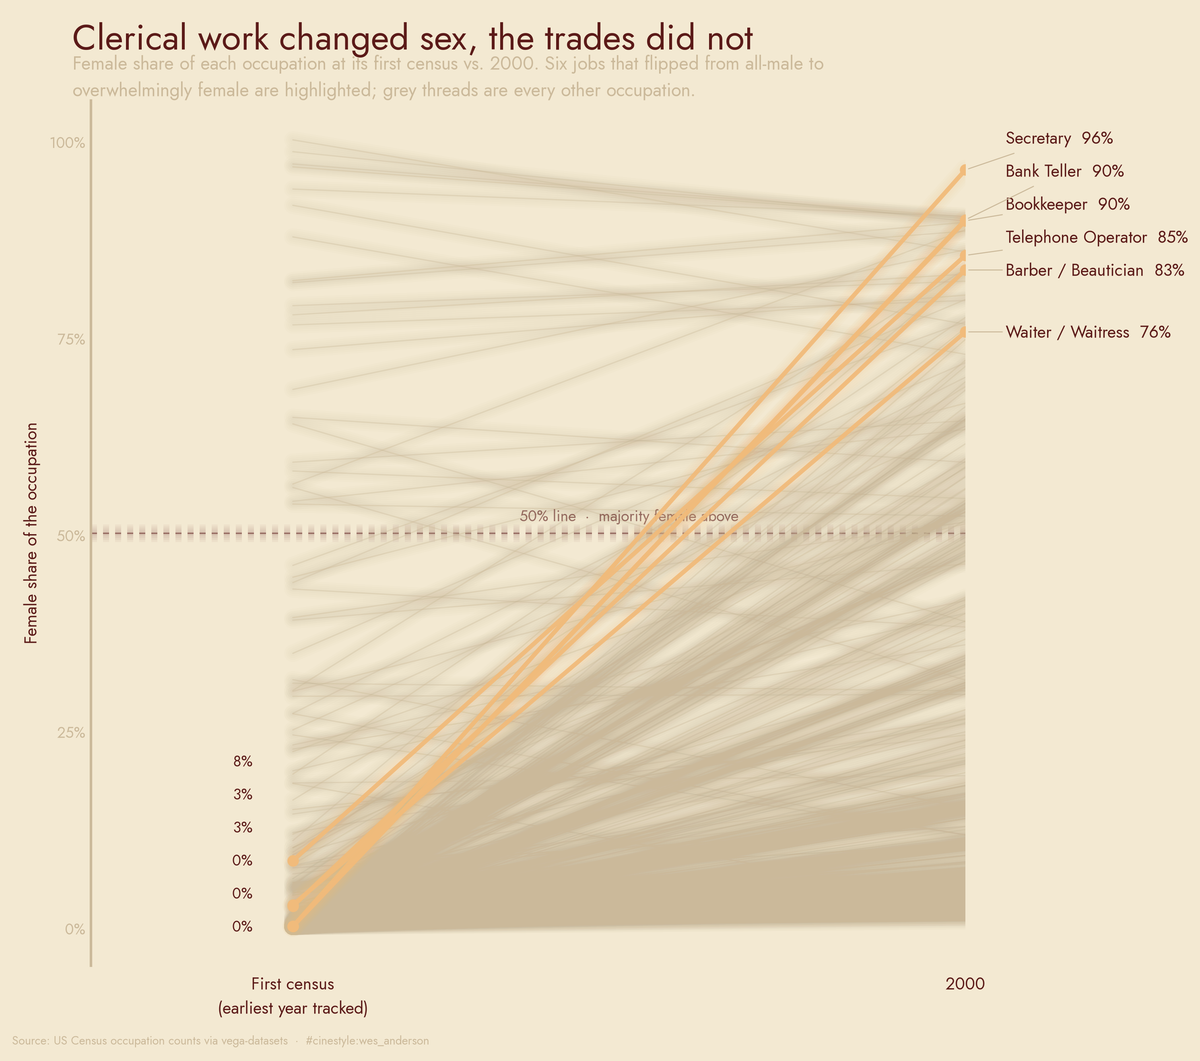
Gender composition in American occupations does not slosh back and forth. Once a job tips toward one sex, it tends to stay there for a century. The exceptions are the clerical and service jobs that flipped, and they all flipped one way.
Read that chart left to right. Each grey thread is one occupation; the orange ones are the half-dozen that started all-male and ended up dominated by women. Almost nothing crosses the 50% line going the other way. That is the part that surprised me.
In 1880 the US Census counted 1,199 secretaries. Every single one was a man. By 2000 there were just over five million of them, and 96.2% were women. That is the cleanest gender flip in 150 years of American occupational data, and it is not a blip. Secretaries hit 74% female by 1900 and climbed almost every decade after, never once reversing.
I went looking for stories like this in the Census occupation counts shipped with vega-datasets (“US Census via vega-datasets”): 7,650 rows, 255 distinct jobs, men and women counted separately at each census from 1850 to 2000. There is no 1890 (the original returns burned), so the record skips that decade.
A column that does not mean what you would guess
The data has a perc column, and I almost trusted it. Do not. I checked what it sums to: within a single sex and year it adds up to about 1 across all jobs (men’s perc totals 0.52 in 2000, women’s 0.48). So perc is each sex’s workforce spread across jobs (what fraction of all working men are secretaries), not the fraction of secretaries who are men. To ask “how female is this job,” I had to throw perc away and recompute female share straight from the raw counts: women / (women + men), per job, per year. Every number below comes from that.
To avoid getting fooled by tiny categories, I required at least 1,000 workers in both a job’s first and last observed census before calling anything a flip.
What flipped
Forty-nine jobs crossed the 50% line from majority-male to majority-female. Two went the other way. The biggest swings, all male-to-female:
- Secretary: 0% to 96.2% (1880 to 2000)
- Bank Teller: 0% to 89.8% (1860 to 2000)
- Bookkeeper: 0% to 89.7% (1850 to 2000)
- Barber / Beautician: 2.6% to 83.5%
- Telephone Operator: 8.4% to 85.3%
- Waiter / Waitress: 2.7% to 75.6%
There is a pattern in that list I did not expect. These are not jobs that opened up to women so much as jobs that got redefined around them. Clerical and service work expanded enormously and pulled in female labor as it scaled. Bank Teller is the tell. A teller in 1860 was a man handling money in a position of some trust; by 2000 it is a front-counter service role that is 90% women. The job title survived; the job changed underneath it.
The two flips going the other direction barely count as jobs. The biggest “female-to-male” swing the analysis surfaced was Inmate (63.9% to 38.8%), which is a census category, not an occupation, and a good reminder that these 255 labels are whatever the Census Bureau decided to track, reconciled across a century and a half of shifting definitions. The only real one is Usher (55.8% to 31.3%).
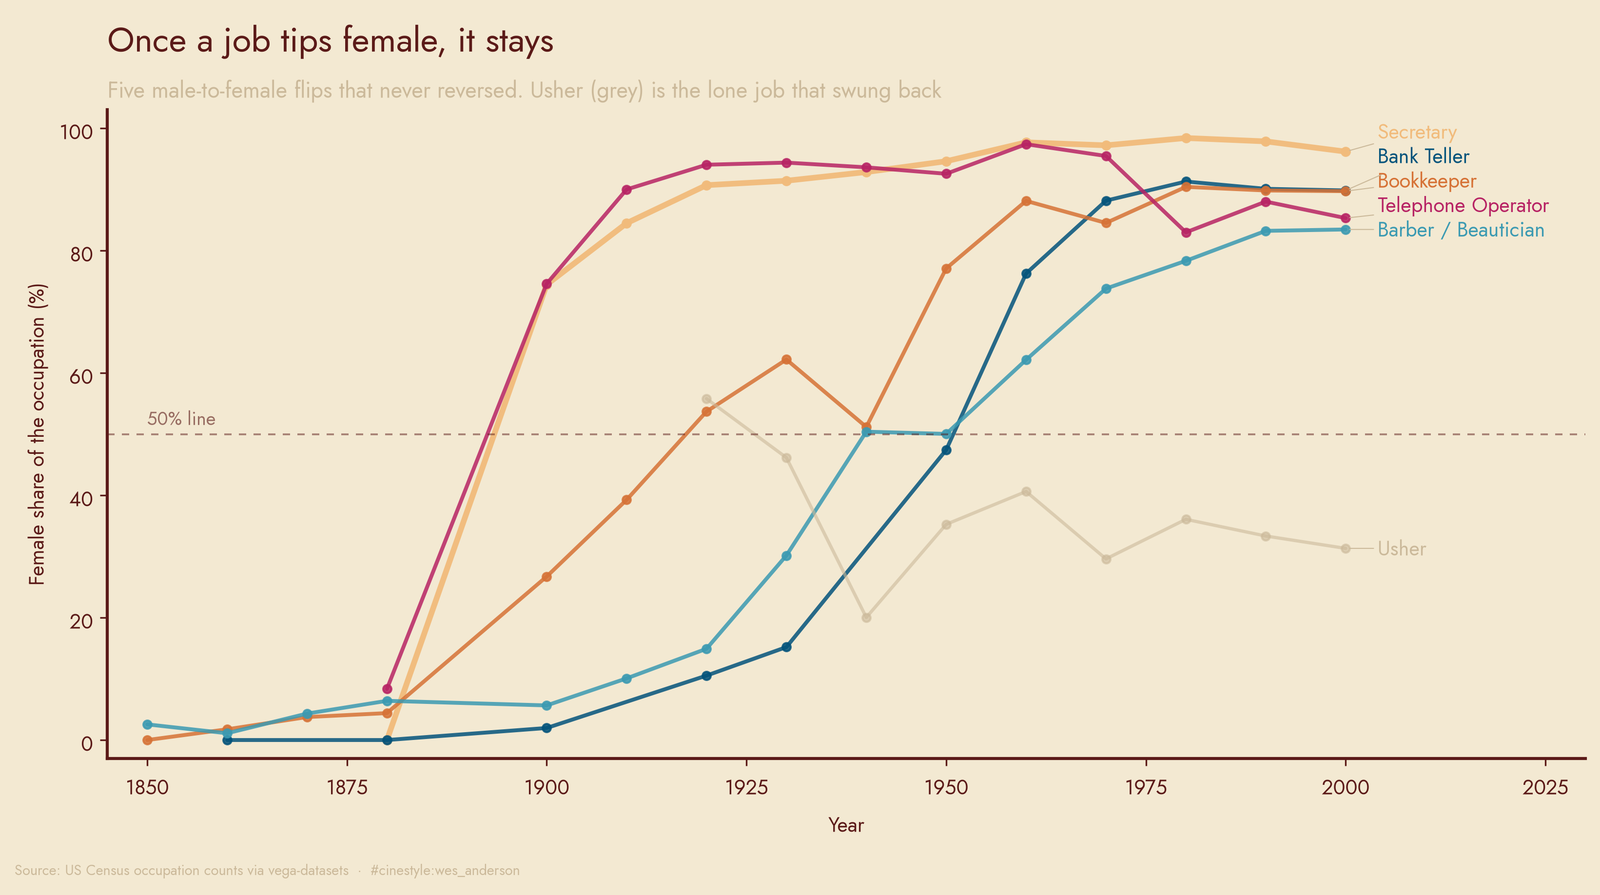
Look at the trajectories. They do not wobble. Secretary, teller, telephone operator: once they start tipping female, they go and they stay. What is off about this chart is how few lines reverse. I expected occupations to slosh back and forth with wars and recessions. They do not. Gender composition, once it moves, has memory.
What never budged
Set against the flippers are the jobs that sat at one extreme the whole time. Among occupations tracked for at least six decades, the female share of Carpenter never rose above 2.0% (mean 0.7%). Electrician topped out at 2.8%. Automobile Mechanic at 2.0%. The Miner, Machinist, and Mechanic trades all stayed effectively all-male from 1850 straight through 2000.
On the other side, Nurse never dropped below 89.7% female across fourteen censuses (mean 94.6%), and Nutritionist sat right alongside it.
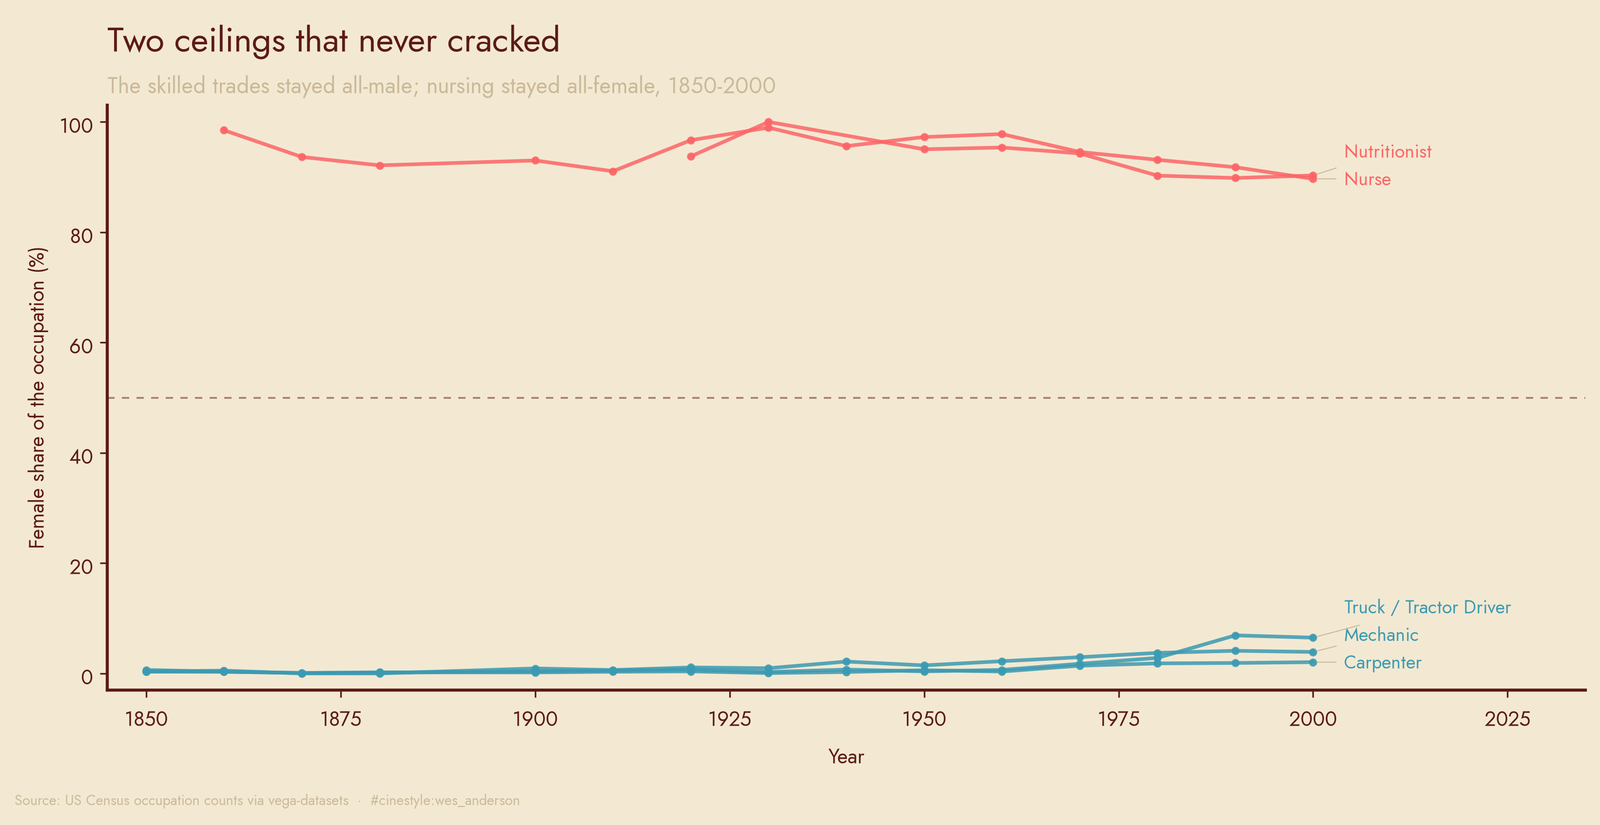
The contrast with the flip chart is the whole point. Clerical work was apparently up for grabs. Swinging a hammer was not. Whatever sorted people into occupations by sex, it gripped the skilled manual trades far harder than it gripped office and care work.
The slow march, and a misleading first data point
Zoom out to the whole labor force and there are two trends, not one.
Women’s share of the recorded workforce climbed from 1.0% in 1850 to 47.9% by 2000, with most of the jump landing between 1950 (27.5%) and 1960 (40.7%). That 1850 figure is almost certainly an undercount of women doing unpaid and informal work the census ignored, so read it as a floor, not a fact.
For segregation itself I used the Duncan index of dissimilarity: the share of one sex who would have to switch occupations for men and women to be spread identically across jobs. It runs 0 (fully mixed) to 1 (fully segregated).
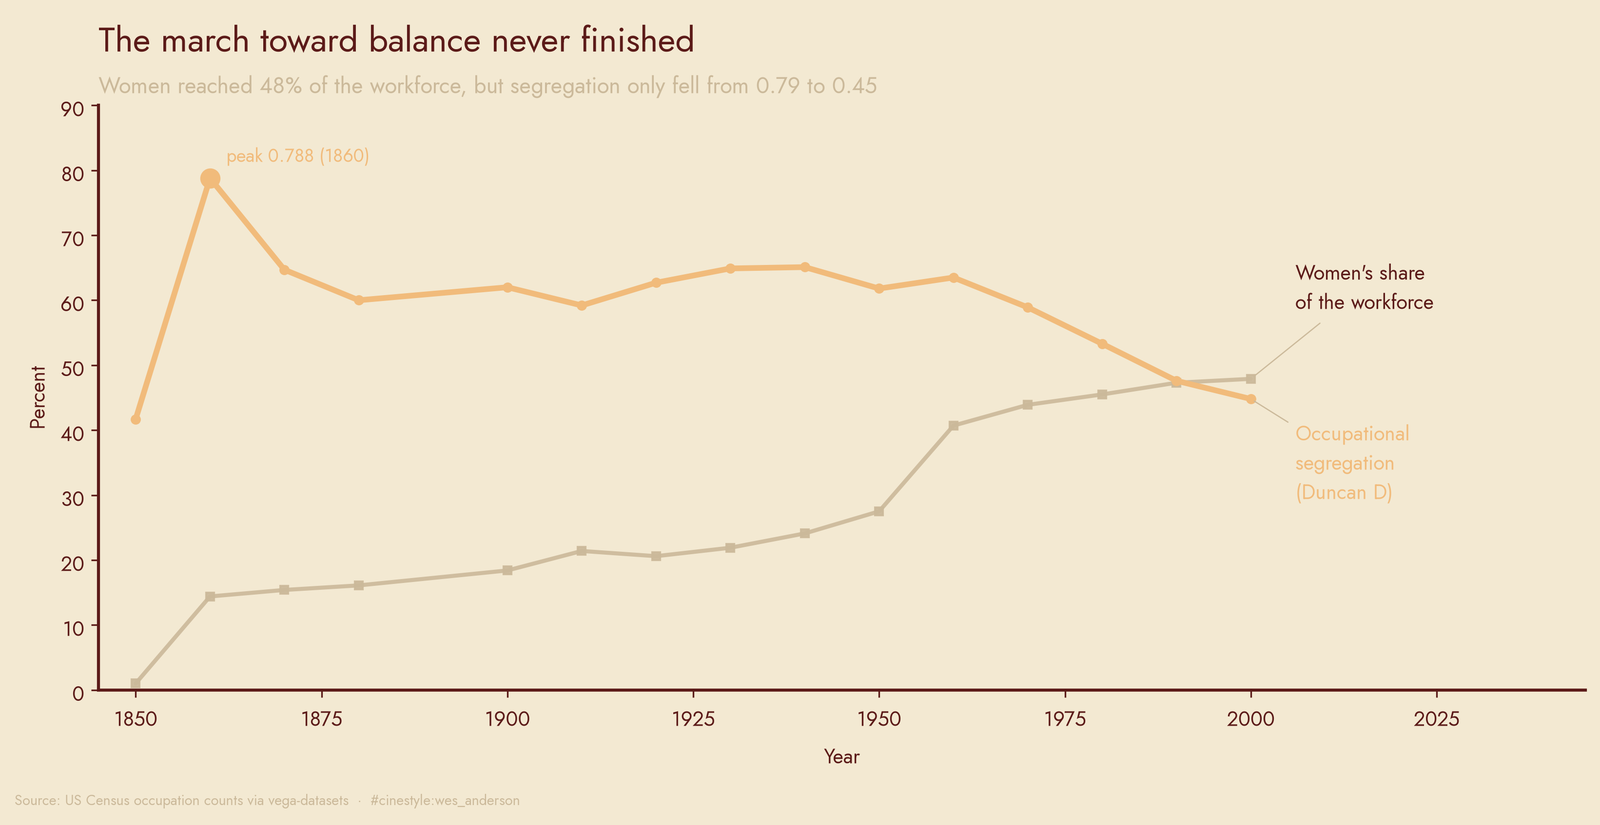
Here is where I had to check my own code. The index reads 0.417 in 1850, which is low, and looks like the workforce started integrated and got worse. It did not. In 1850 women were barely in the paid workforce at all (that 1.0%), so there were almost no women to be segregated from; the index is meaningless at the edge. The real peak is 1860 at 0.788, with the recorded female share now at 14.4%. From there it grinds down: 0.62 around 1900, still 0.618 in 1950, then a genuine decline to 0.448 by 2000.
So the honest summary is the unsatisfying one. Women went from 1% of the counted workforce to nearly half. But occupational segregation, measured properly, fell by only about 40% from its 1860 peak (0.788 down to 0.448) and was still at 0.45 in 2000, meaning roughly 45% of workers would have had to change jobs for the sexes to be evenly mixed. The composition flipped dramatically inside individual occupations like Secretary. Across occupations as a whole, the sorting loosened but never came apart.
Carpenters were 99% male in 1850. They were 98% male in 2000. Some lines on these charts move a long way. That one did not move at all.