// article
The Health-Spending Gap
In 1991 the US health-spending gap crossed $1,000 and never came back
For most of the 1970s the United States looked like a slightly expensive member of a rich-country club. In 1970 it spent 29.6% more per person on health than the next-biggest spender. A premium, sure, the kind you could wave off as exchange rates and expensive labor. Then the gap between the US and the #2 country crossed $1,000 per capita for the first time in 1991, and it has only widened since. By 2020 the US was spending $4,920 more per person than the next country in line. That is not a premium anymore. That is a different curve.
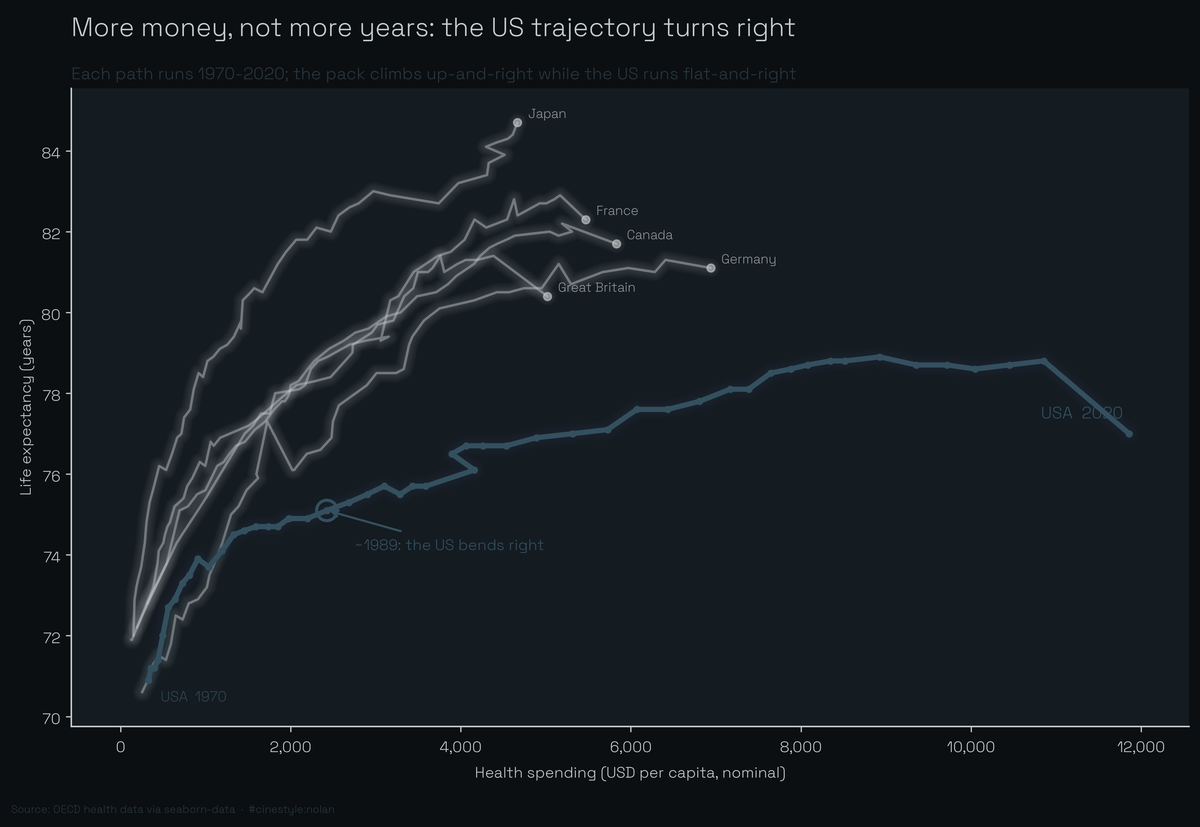
That whole story fits in one chart. Each line is a country’s path through (spending, life expectancy) space as the years tick by, 1970 on the left, 2020 on the right. The pack climbs up and to the right, more money for more years. The US starts on the same diagonal and then, around 1989, bends hard to the right: it keeps spending, year after year, while the life-expectancy axis barely moves. It is the one path that buys dollars instead of years. The rest of this post takes that path apart.
I had already looked at these six countries cross-sectionally, one snapshot year, the US sitting off to the right of everyone else. What I had not done was watch the snapshot become true. So I pulled the OECD series that ships with seaborn (load("healthexp"), sourced as “OECD via seaborn-data”): 274 rows, six countries (Canada, France, Germany, Great Britain, Japan, the USA) with per-capita spending in nominal USD and life expectancy, running 1970 to 2020. Not every country starts in 1970 (Canada’s first year is 1971, France and Britain have gaps in the ’70s and ’80s), so where I needed a fair comparison I used the 1980 to 2020 window, the earliest stretch where all six report every needed year.
The breakaway has a date
Watch the gap between the US and whichever country is in second place, year by year, and the separation runs gradual and then sudden. In 1980 the US was only $128 per capita ahead of the runner-up. By 1990 that gap was $961, and a year later it punched through $1,000 and kept climbing: $1,641 by 2000, $3,456 by 2010, $4,920 by 2020.
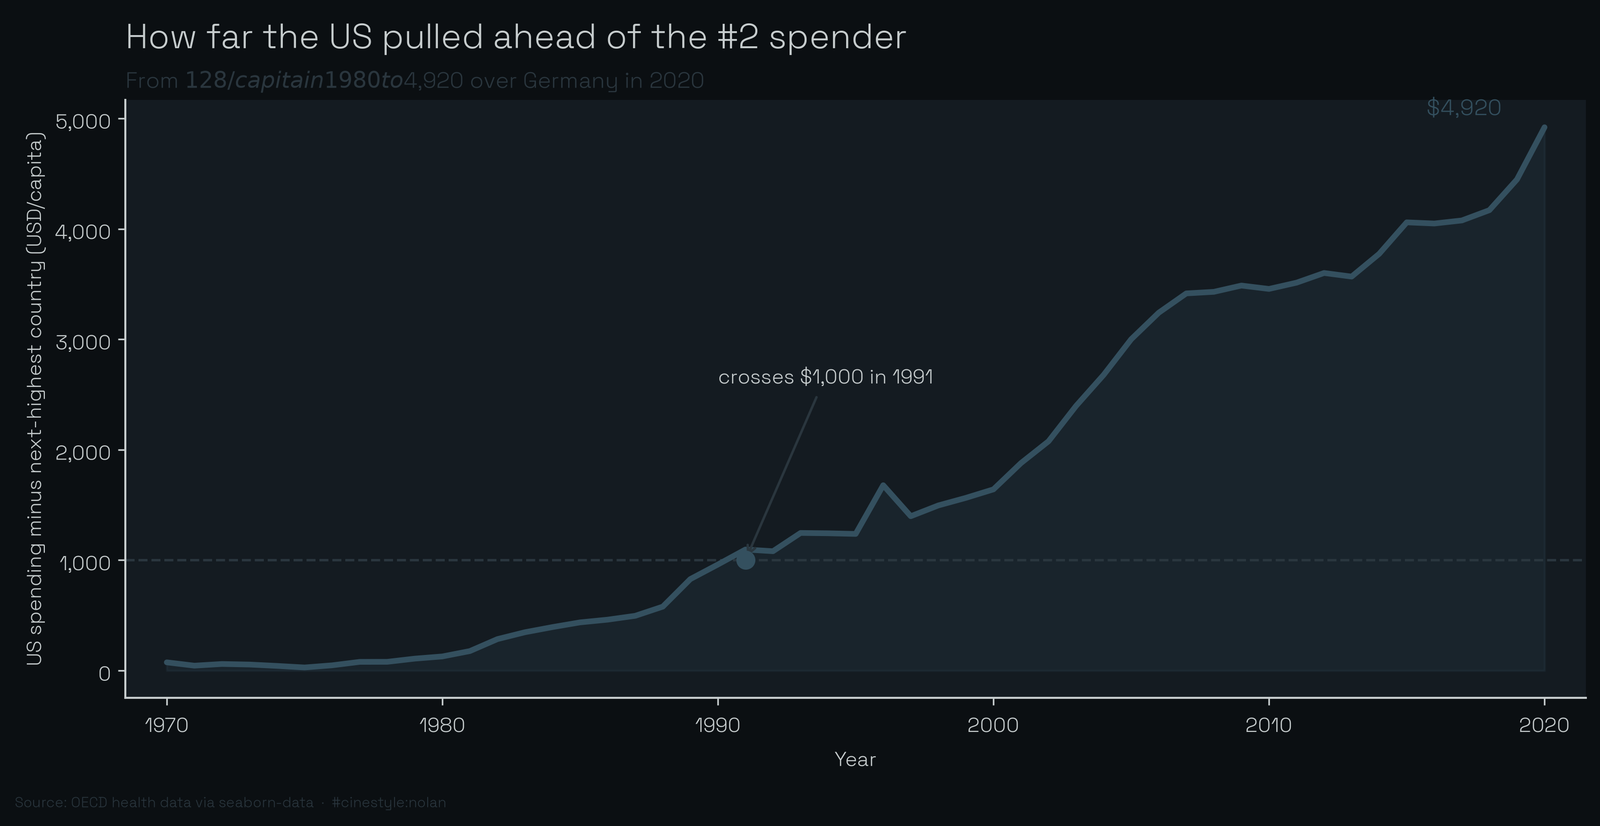
If you want a single year for the breakaway, 1989 is the cleaner one. That is when the US premium over the #2 country first cleared 50%. The dollar gap crossing $1,000 in 1991 is the same event measured in absolute money. Either way it is late-’80s, early-’90s. Before that the US was expensive. After it, the US was on its own.
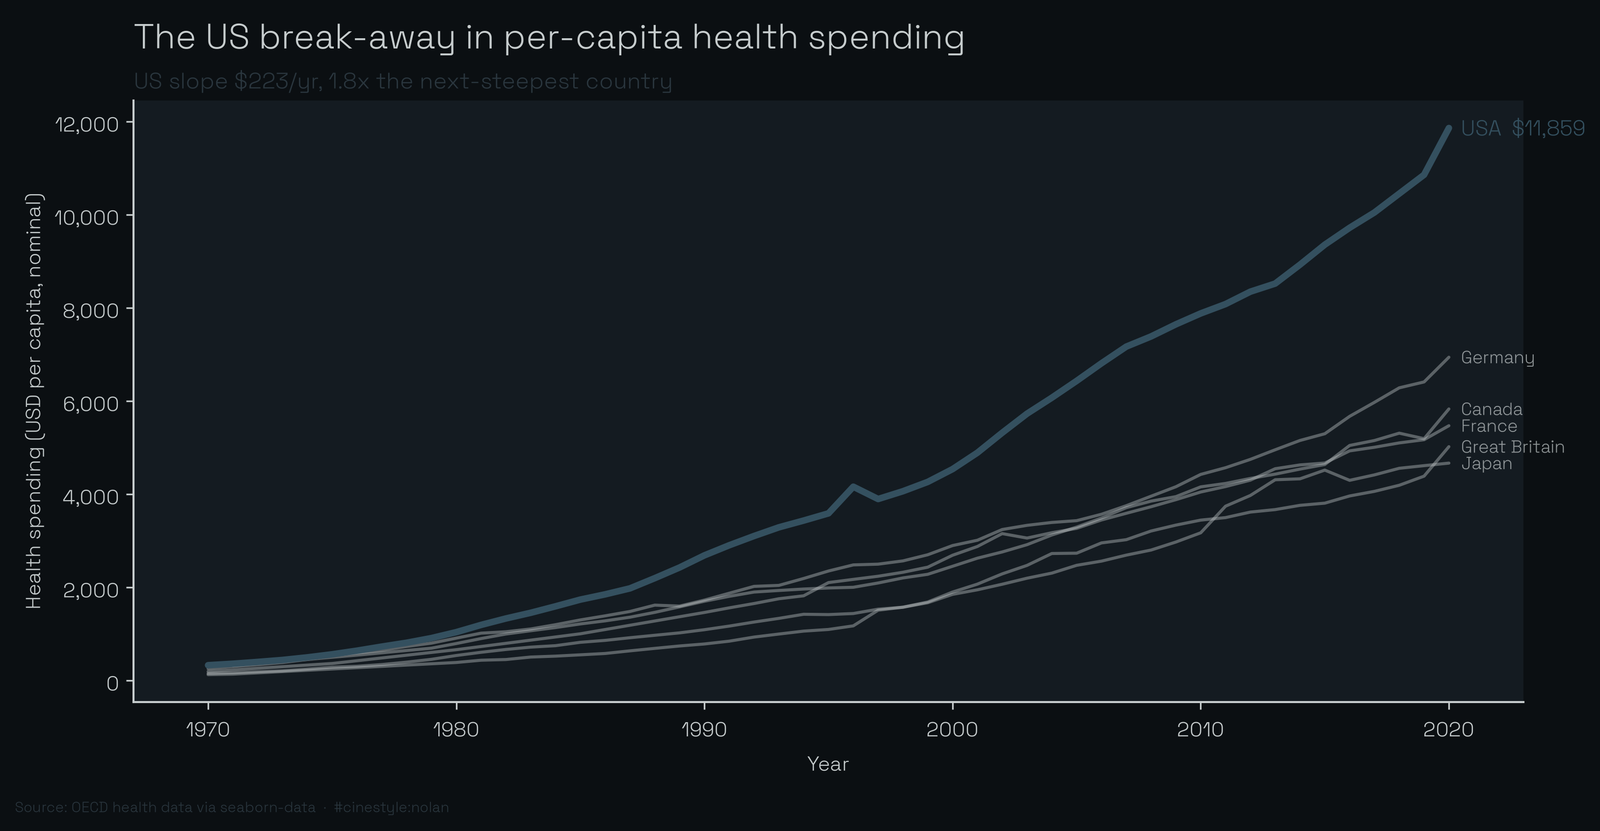
The trajectory chart shows it plainly: five lines bunched in a band along the bottom, and one (the highlighted one) peeling off and accelerating. Fit a straight line to each country’s spending over its full span and the US gains $222.80 per capita every year. The next-steepest is Germany at $122. The US slope is 1.8 times the runner-up’s.
Here is where the easy story breaks, because it broke for me. In percentage terms the US is not the fastest grower. Its compound annual growth rate over 1980 to 2020 is 6.28%, which beats the other five’s average of 5.59%. But Great Britain grew faster, at 6.63% a year. Britain just started from a much smaller base ($124 per capita in 1970), so 6.6% of a small number stays a small number. The US grew quickly off an already-large base, which is the worst of both: high rate, high starting point, runaway total. The CAGR ranking puts the US second. The dollar ranking puts it first by a mile. Both are true, and the gap between them is the story.
The pack converged, the US left
Here is the part I did not expect. While the US was breaking away, the other five were drifting together. Take the coefficient of variation, the spread of spending relative to its mean, across just those five countries. In 1980 it was 0.281. By 2020 it had fallen to 0.140. Their relative dispersion halved over forty years. France, Germany, Canada, Britain, Japan: they ended up clustered.
Now compute the same coefficient of variation across all six. It went the other way: 0.306 in 1980 up to 0.369 in 2020. One country single-handedly turned a converging group into a diverging one. Pull the US out and you have a textbook convergence story. Leave it in and the dispersion grows. The US is not a fast member of the pack. It is a separate phenomenon dragging the variance around.
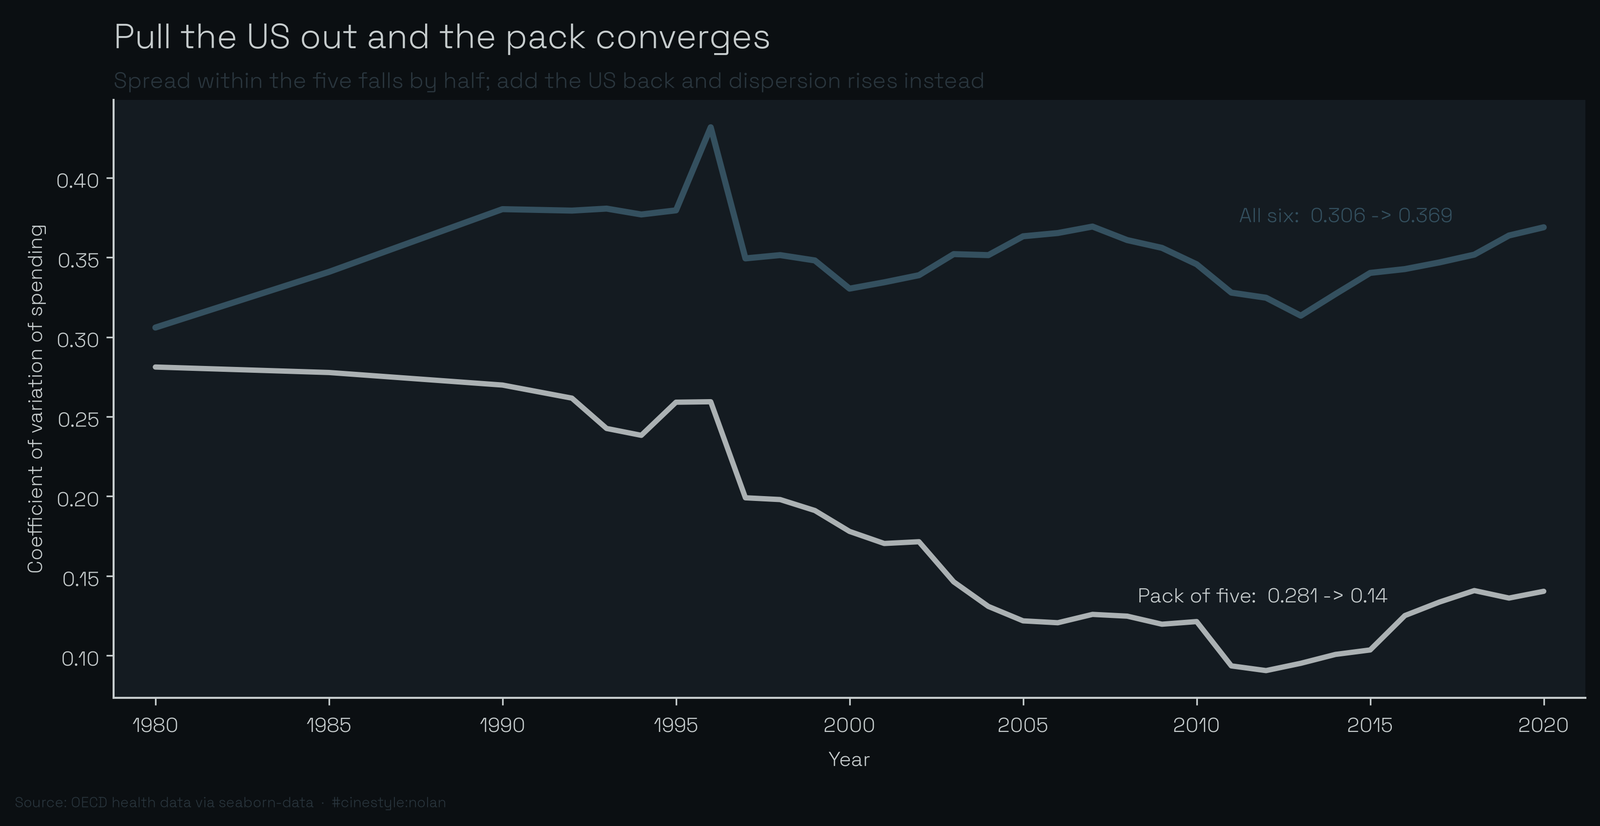
The two lines work against each other. The lower line, the pack of five, slides steadily down as those countries’ spending levels draw together. The upper line, all six, drifts up, because the US is pulling away faster than the others can converge.
Everyone bought more life, the US bought the least
So did all that spending buy America anything? Every country in the set gained life expectancy. This is not a story of decline. Over the full span Japan gained 12.7 years, Germany 10.5, France 10.1, Canada 8.9, Britain 8.5. The US gained 6.1, the smallest gain in the group, off the largest and fastest-growing spend. On the matched 1980 to 2020 window the contrast is sharper still: the US added 3.3 years while the other five averaged 7.7.
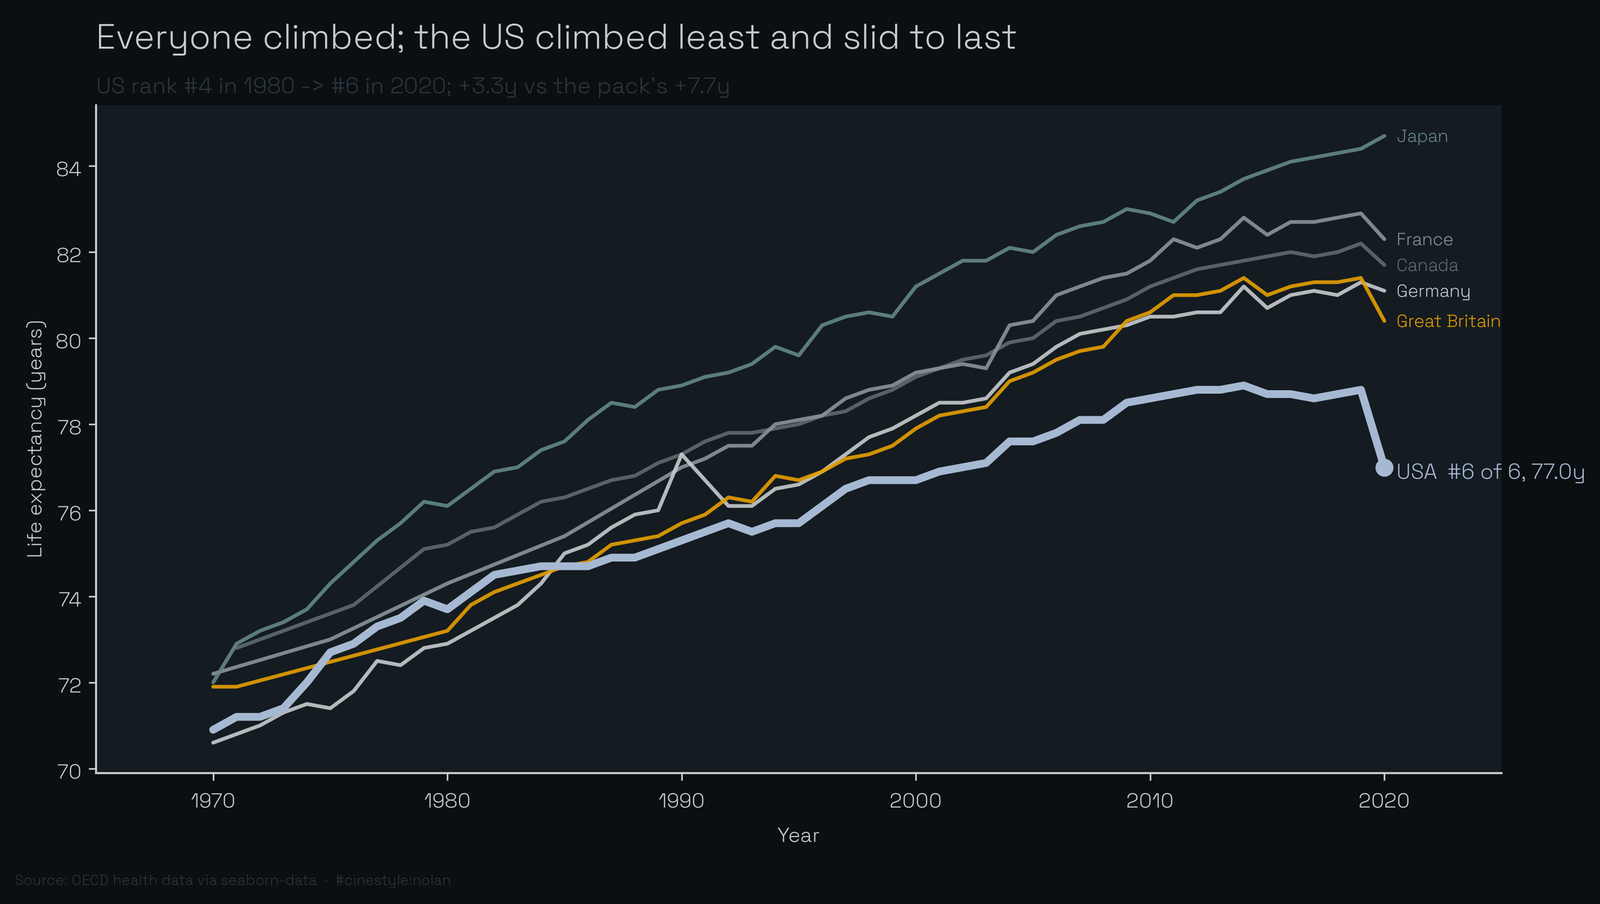
That shortfall shows up as a rank slide. Canada has no 1970 life-expectancy figure, so in 1970 only five countries report; the US ranked 4th of those five at 70.9 years, middle of the pack, nothing alarming. It still ranked 4th in 1980, now of all six. By 2020 it had fallen to 6th of six, dead last, at 77.0 years, while the countries it used to sit beside pulled away upward. It went from the middle to the back without its absolute number ever dropping. Everyone else just climbed faster.
Which brings us back to the trajectory chart at the top. That is the one I would put on the wall. The five non-US lines sweep up and to the right, more money and more years, a healthy diagonal that bunches into a cluster at the top. The US line starts on that same diagonal and then, somewhere in the late 1980s, bends hard to the right: it keeps moving right, more spending year after year, while barely rising. It buys dollars, not years.
The honest caveats: this is nominal USD, not PPP-adjusted, so part of the US gap is just expensive American dollars buying expensive American care rather than more of it. It is six wealthy countries, not the world. And life expectancy answers to guns, cars, diet, opioids, and inequality, none of which are columns here. The data can tell you when the US trajectory broke from the others and that the break kept widening. It cannot tell you the health system did it.
What it can say is when. The US did not drift from the pack. It left, around 1989, and the door has not closed since.