// article
Gold in Real Terms
Gold made its real high in 1980, and has been losing the rematch ever since
An ounce of gold cost about 19 dollars in January 1871 and about 1,916 dollars in September 2023. That is a 101x climb, the kind of number that sells newsletters. Adjust for what a dollar actually bought across those 152 years and the climb shrinks to 4.1x. The headline price went up by two orders of magnitude. The purchasing power went up by a single digit, and most of that gain arrived and then left again.
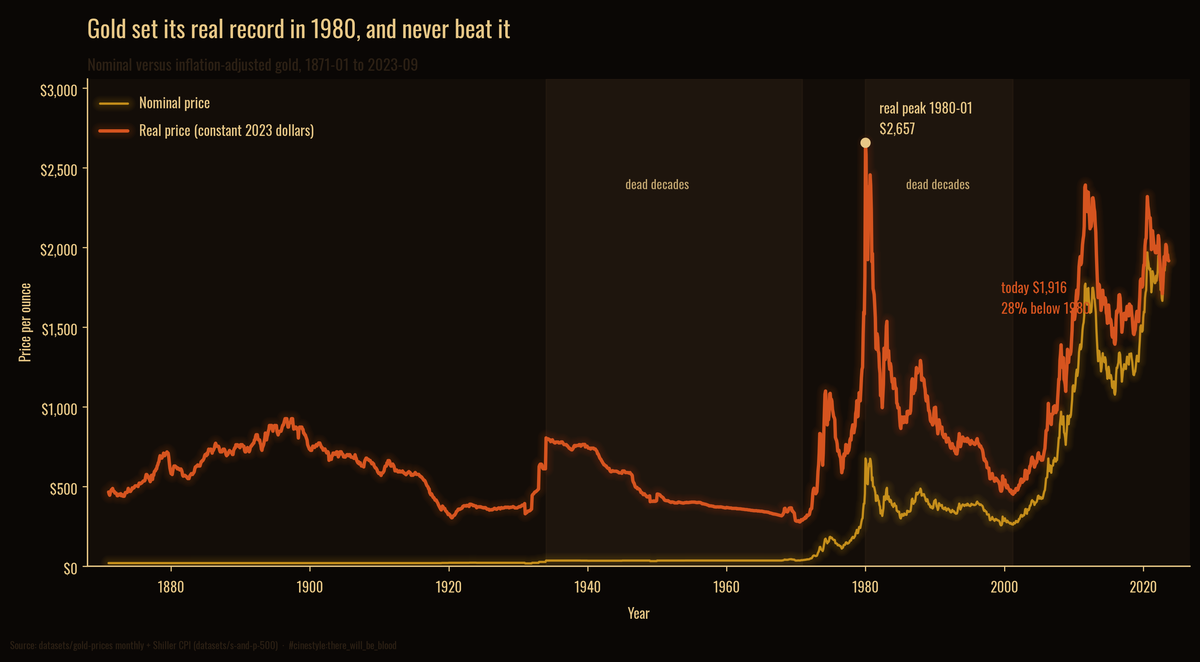
The amber line is the price you read in the paper. The rust line is the same gold in constant 2023 dollars. They tell different stories, and the gap between them is inflation doing its quiet work. The rust line set its record in January 1980 and has not touched it since.
The data is two monthly series aligned by month: gold prices from the datasets/gold-prices repository, and the Consumer Price Index column from Shiller’s S&P 500 dataset. The overlap runs 1871-01 to 2023-09, which is 1,833 months. I deflate every gold price to September 2023 dollars using CPI, so the rust line answers one question at every point: what would that month’s gold buy, priced in today’s groceries.
When the real price matters and when it does not
If you are quoting a price to settle a trade tomorrow, nominal is the only number that exists. Real is a distraction. Use it and you will book the wrong figure.
If you are asking whether gold preserved wealth across a working lifetime, nominal is the lie of convenience. A retiree who bought at the 1980 high and held for 43 years is still down in the only terms that buy food. The chart that hides that is the nominal one.
The test is simple. Are you spending the money soon, or storing it for years? Storage is a real-terms question, and gold’s real-terms record is far rougher than its headline suggests.
The 1980 peak is a wall, not a milestone
Real gold topped out at about 2,657 constant dollars in January 1980. The nominal price that month was 675 dollars. Forty-three years and seven months later, the real price sat at 1,916, which is 28 percent below that peak. It has never closed back above it.
Sit with that. The most famous safe-haven asset on earth made an inflation-adjusted high during the Carter administration and has spent every month since underwater against it. The nominal price hit a fresh record of about 2,000 dollars in April 2023, and the financial press called it an all-time high. In real terms it was nothing of the sort. The 1980 buyer is still waiting.
The dead decades
The real price does not drift down gently. It collapses, then stays down for a human generation.
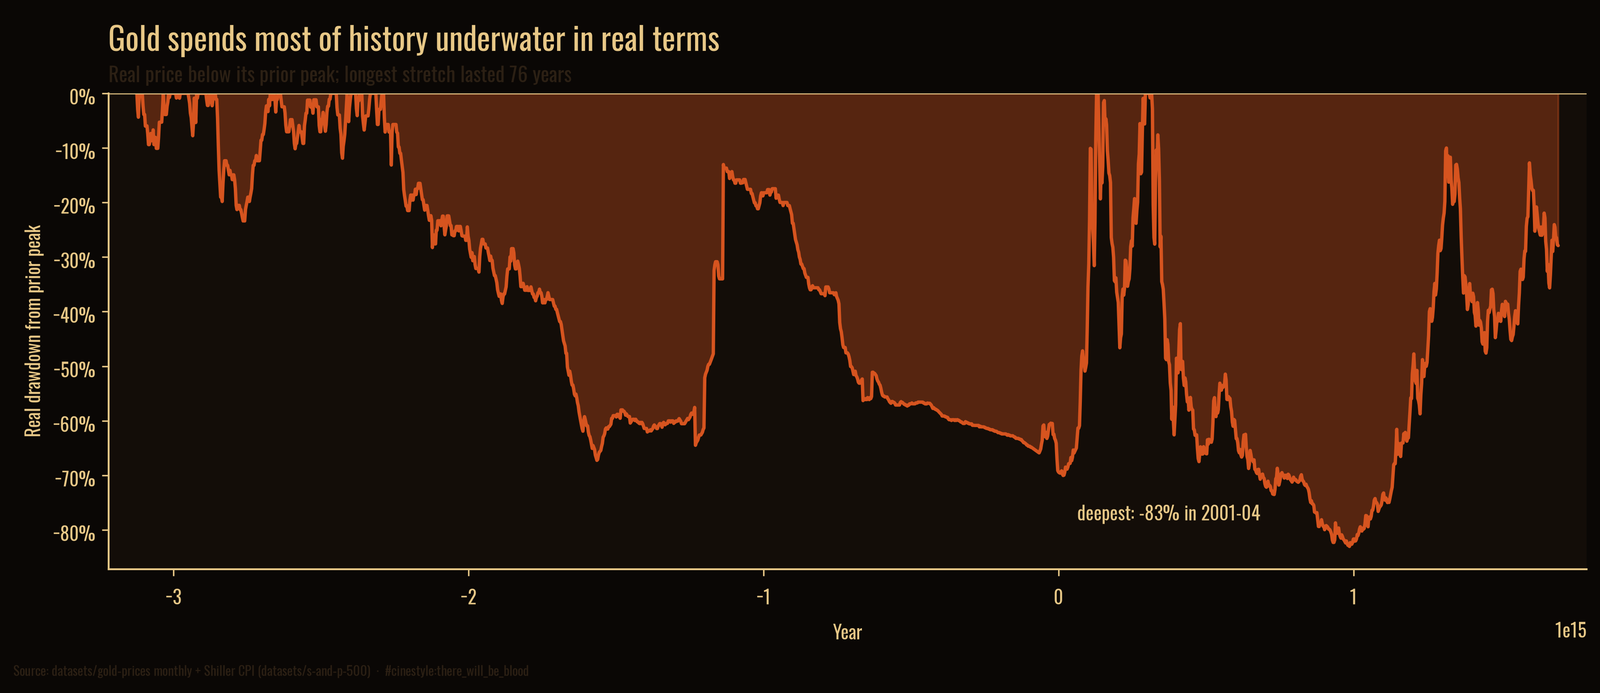
This is the drawdown from each running real peak. The line touches zero only when gold sets a new real high, and it spends the rest of its life below the surface. The deepest point is brutal: by April 2001, real gold had given back 83 percent of its 1980 value, falling from 2,657 dollars to 451. Twenty-one years of decline, priced in constant dollars, for an asset people buy precisely because it is supposed to hold.
The longest single stretch underwater ran 76 years, from August 1897 to January 1974. That one needs a caveat I owe you, because it is mostly an artifact of policy rather than markets.
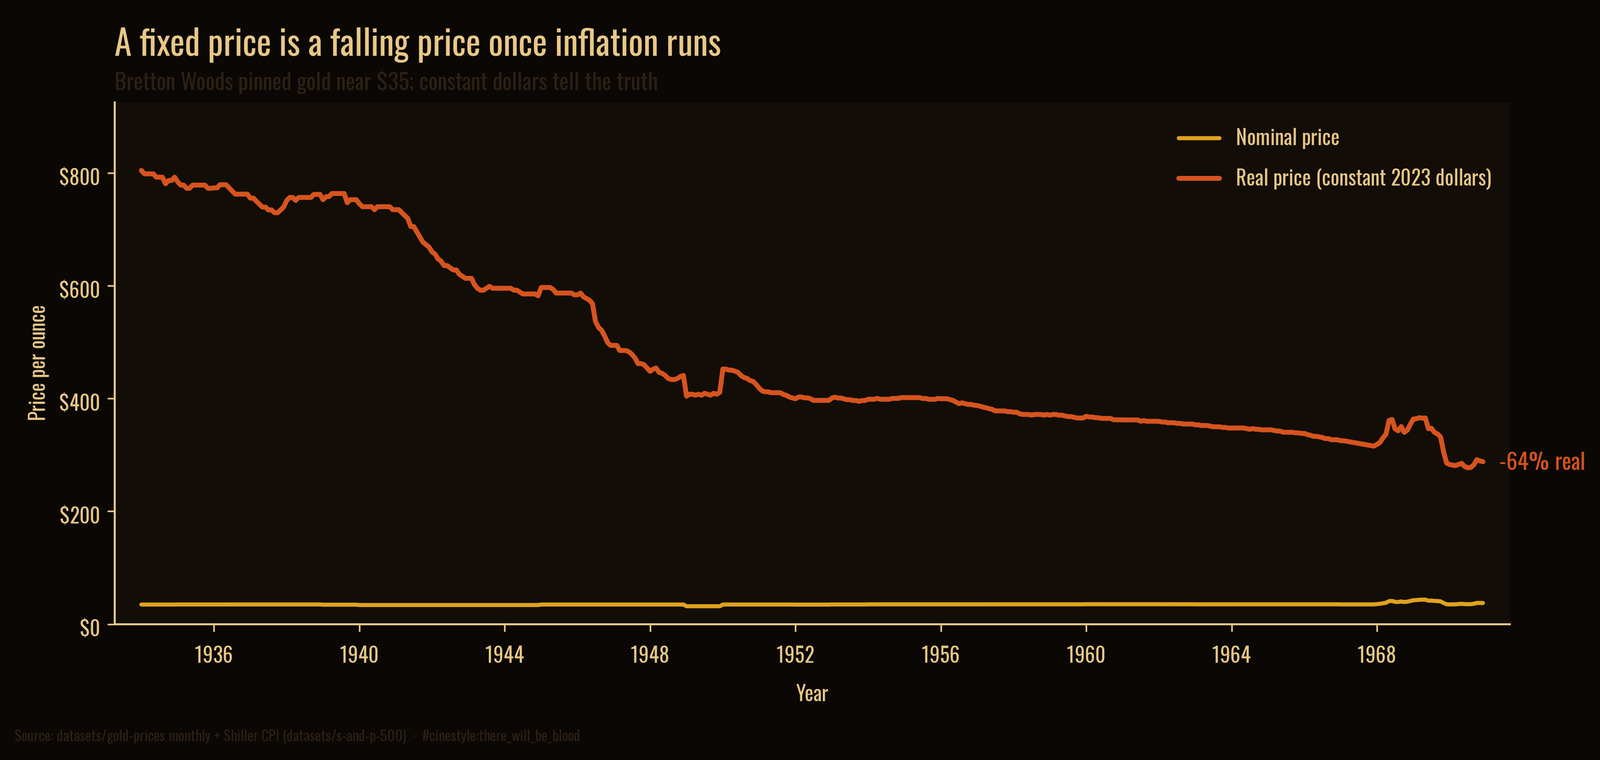
For most of that span the nominal gold price was fixed by law. Across the entire pre-float era the nominal price never left the 17-to-35-dollar band. Under Bretton Woods it was pinned near 35 dollars. A pinned nominal price is a falling real price the moment inflation runs, and it ran: from 1934 to 1970 the real value of that fixed ounce dropped 64 percent without the headline number moving at all. So the 76-year underwater stretch is real arithmetic, but it is the arithmetic of a price control, not of a freely traded market panicking.
The post-1980 decline has no such excuse. Gold floated freely the whole way down.
What the multiple actually was
Strip the two pictures down to one comparison and the gap is the entire point.
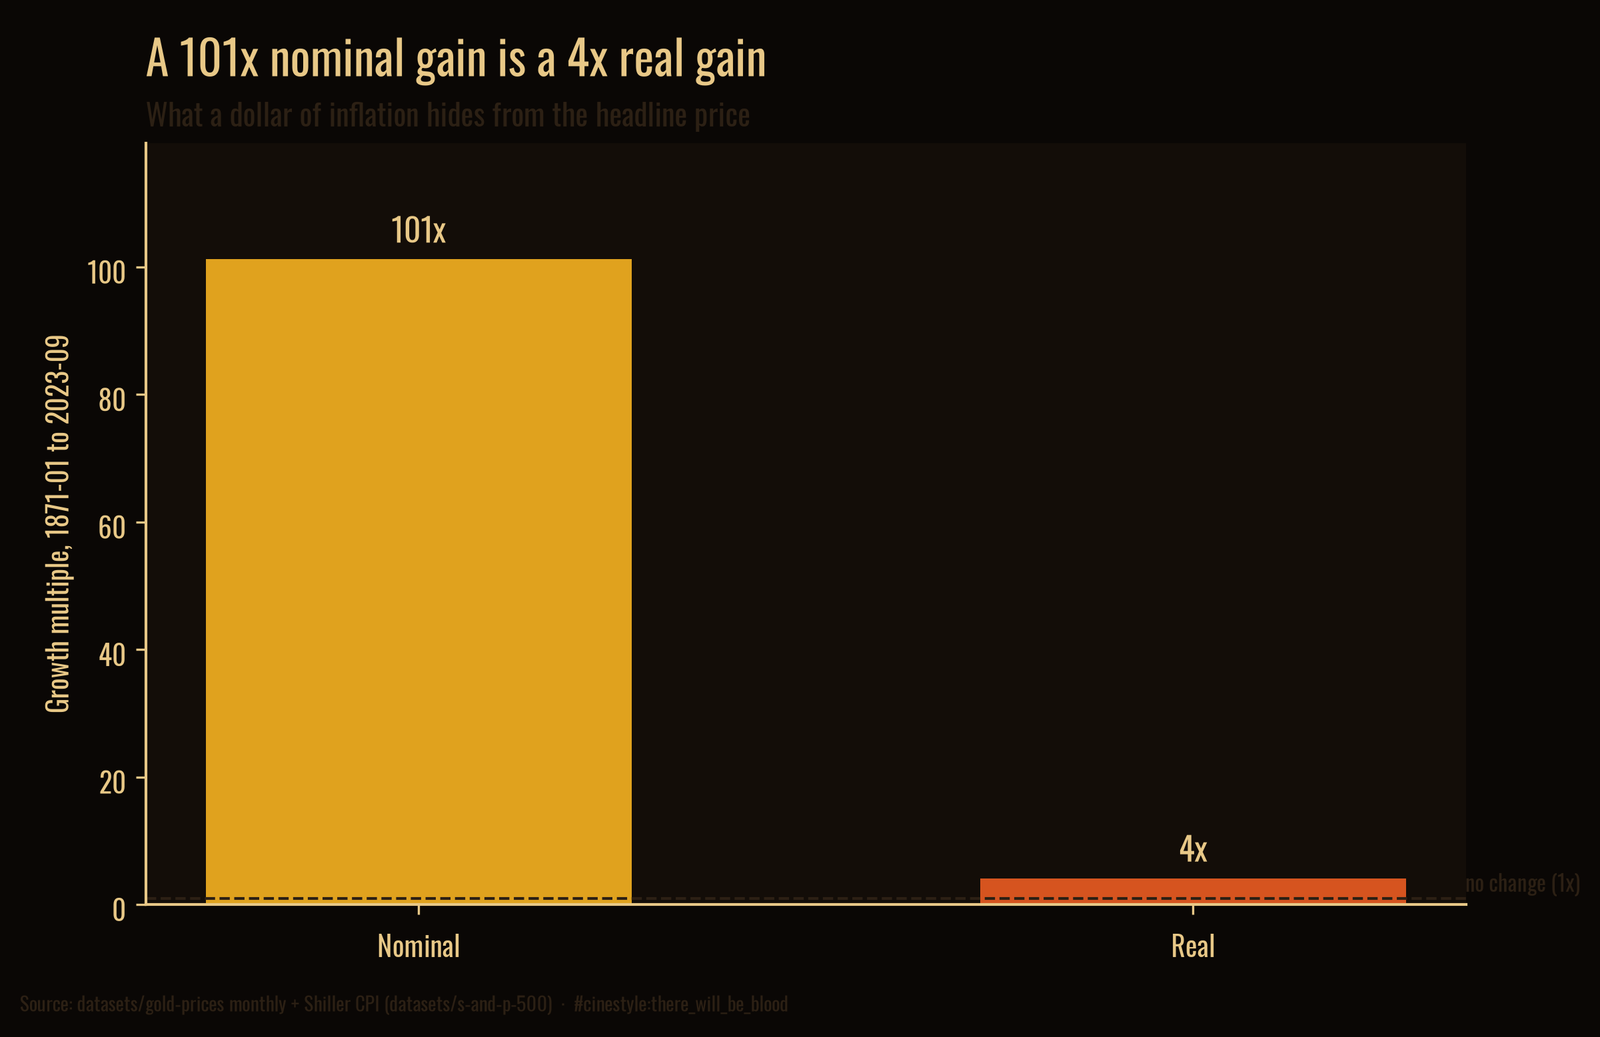
Over 152 years, nominal gold grew 101x and real gold grew 4.1x. Both bars start at true zero, so their heights are honest about the ratio: the nominal story is roughly twenty-five times larger than the real one, and that factor of twenty-five is the cumulative bite of inflation since 1871. The 4.1x is not nothing. An asset that quadruples your purchasing power across a century and a half has done a job. But it did that job in two short bursts separated by decades of erosion, not as the steady store of value the brochures promise.
The caveat I owe you
This is one deflator and one gold series. CPI is a contested measure of the price level, and reasonable people argue its basket understates or overstates the cost of living in different eras; a different inflation index would shift every real number here by some amount. The gold series is a monthly average, not an intraday high, so the true 1980 peak briefly ran higher than 2,657 dollars. And I am deflating to September 2023, the last month where the CPI column carries a real reading, so “today” means late 2023, not this morning’s quote.
None of that moves the shape. Gold’s real record is a single towering peak in 1980, a 21-year, 83-percent collapse after it, and a price that even now sits a quarter below where it stood when Carter was in office. The nominal chart is a triumph. The real one is a warning, and the warning is the true picture.