// article
The GLUE Leaderboard
The 0.7 points that decide a leaderboard, and where they come from
A leaderboard mean is one number standing in for a whole table. It is honest only when the columns it averages measure the same kind of thing. On this GLUE snapshot they do not, and one column quietly decides the ranking.
ERNIE sits on top with a mean score of 89.7. T5 is right behind at 89.0. Seven tenths of a point separates first from second, and if you only read the headline column that is the whole story. ERNIE wins, ship the press release.
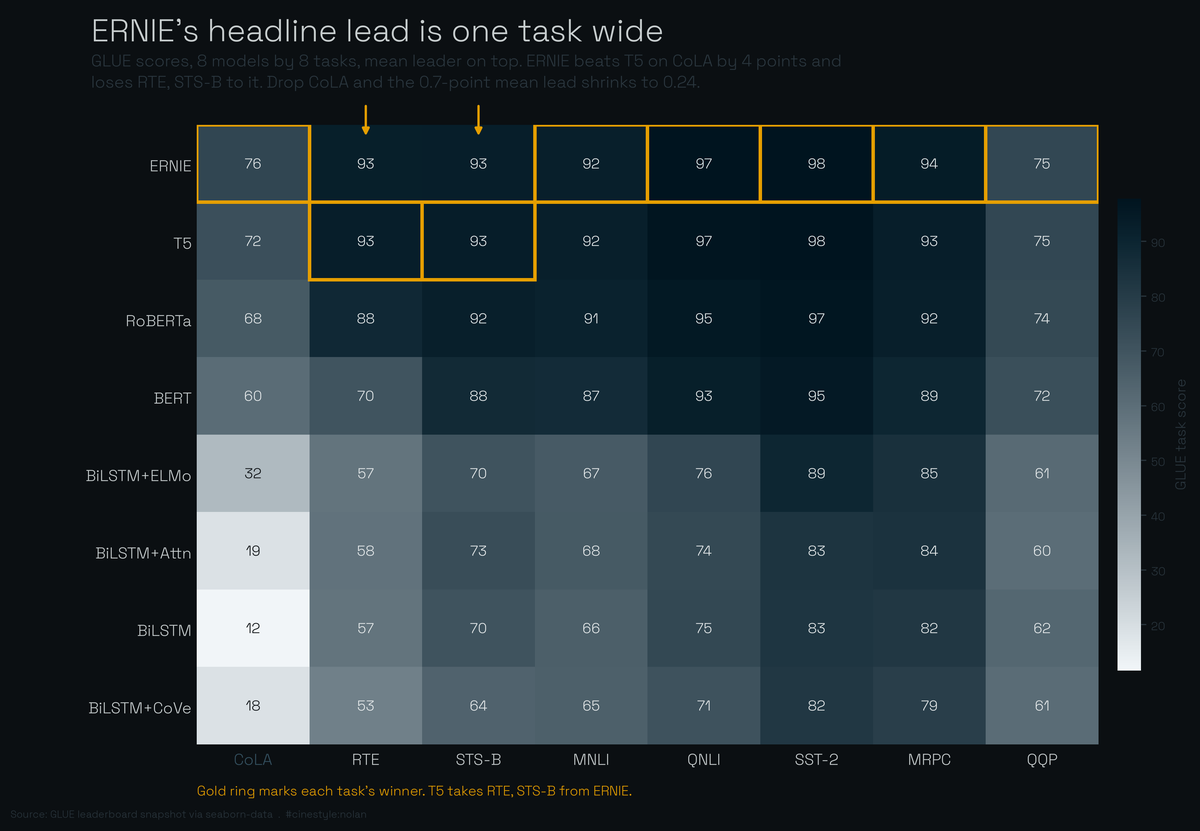
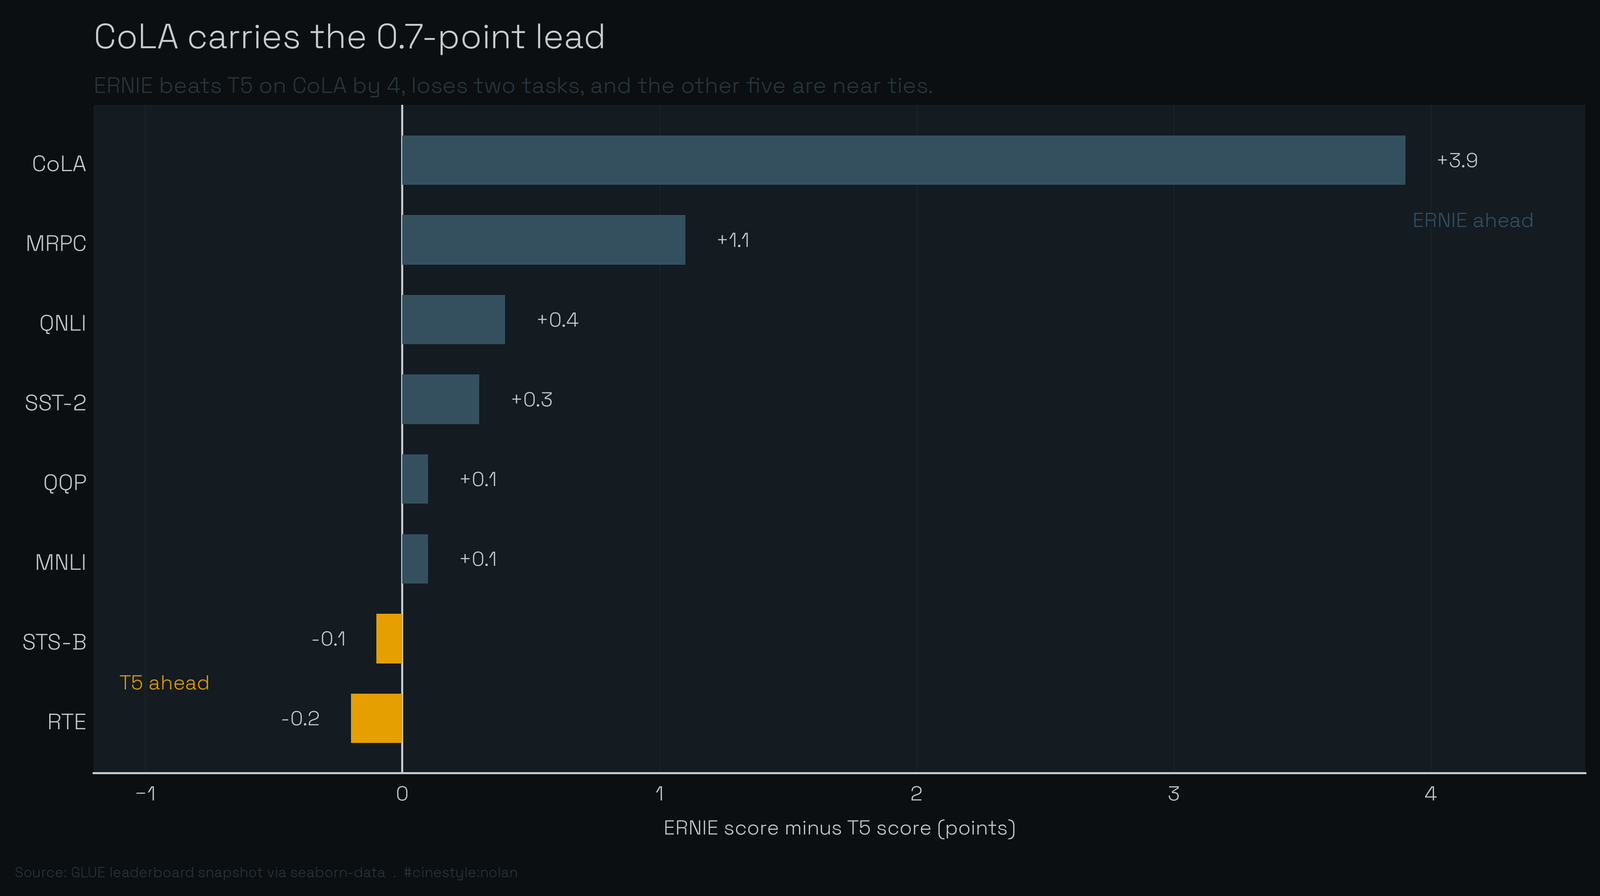
Pull the tasks apart and that 0.7 stops looking like a verdict. ERNIE loses two of the eight tasks outright, both to T5, and its lead is almost entirely one column wide. On CoLA it beats T5 by 3.9 points. Strip CoLA out and the mean lead over the other seven tasks collapses to 0.24. The ranking does not flip, but the margin nearly vanishes, and what is left is a near-tie decided by which already-solved tasks happen to be in the suite. The average did not measure which model is better. It measured which model happened to be good at the one task with room to move.
What is actually in the table
The data is a small, tidy snapshot of the GLUE leaderboard pulled from seaborn-data: 64 rows, 8 models crossed with 8 tasks, plus the encoder family (LSTM or Transformer) and a year between 2017 and 2019. That is it. It is not the live leaderboard, it predates the whole instruction-tuned-LLM era, and four of the eight models are BiLSTM variants that nobody would deploy today. So treat the absolute numbers as a period piece. The structure of the problem, averages hiding per-task weakness, is what carries over, and that you can see cleanly because the table is so small.
Each row is a single score. Group by task and you get the spread across all eight models. Group by model and you get the mean that the leaderboard sorts on. I did both.
Some tasks are decided, some are wide open
This is the part that reframes everything else. The range across models, task by task:
- CoLA: 11.6 to 75.5, a 63.9-point spread
- RTE: 52.7 to 92.8, 40.1 points
- STS-B: 28.7, MNLI: 26.9, QNLI: 26.5
- SST-2: 15.9, MRPC: 15.2, QQP: 15.1
CoLA is an outlier and not a subtle one. Its spread is four times wider than QQP’s. The worst model scores 11.6, a system that has essentially not learned the task, since CoLA is grammatical-acceptability judgment scored by correlation and a coin flip lands near zero. The best scores 75.5. The whole eight-model field is smeared across 64 points of that axis.
Now look at the tight end. On QQP, MRPC, and SST-2 every model lands within about 15 points, and the ceilings sit high: SST-2 tops out at 97.8, MRPC at 93.9. These tasks are close to saturated. A new model can only win them by tenths. They separate almost nothing, yet they count equally toward the mean.
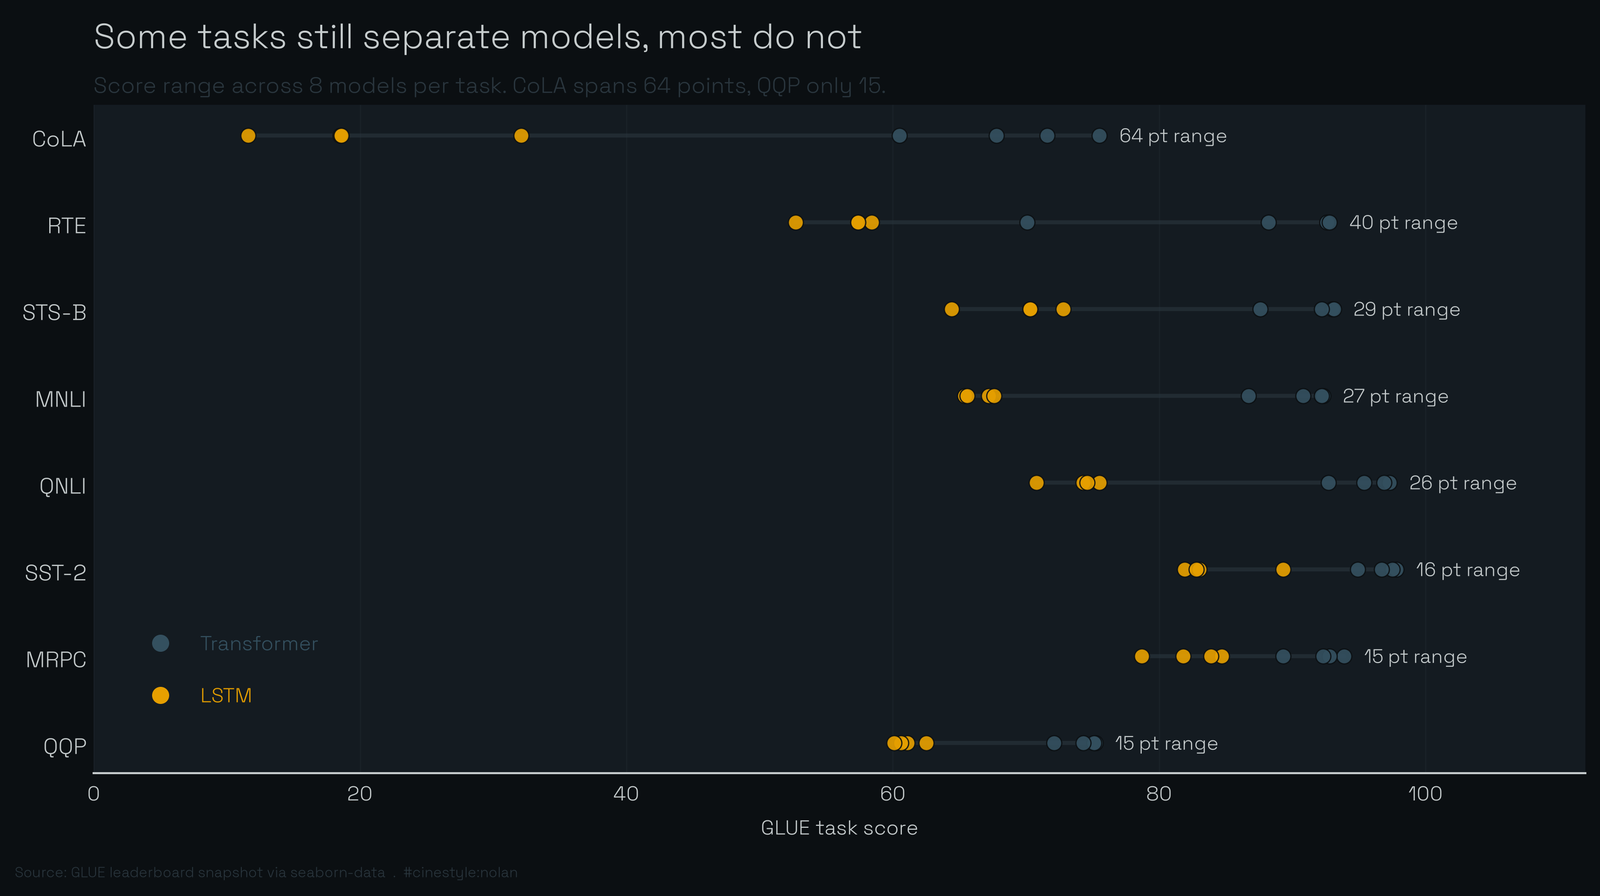
The figure makes the asymmetry obvious, and it shows something the numbers alone do not: the spread is not random, it tracks the encoder. Color the points by encoder family and CoLA splits into two clusters. The four Transformers sit between 60.5 and 75.5, the four LSTMs scrape the floor between 11.6 and 32.1. That one task is doing most of the work of telling the architectures apart. On the saturated tasks the two families nearly overlap.
So a mean over eight tasks is a mean over eight very different measuring sticks. One of them, CoLA, has a 64-point dynamic range. Three of them have barely 15. Each still gets an equal vote.
The top model is not uniformly good
ERNIE’s mean is 89.7. Its best task is SST-2 at 97.8. Its worst is QQP at 75.2. That is a 22.6-point gap inside a single model, and the headline number sits almost dead center, telling you about neither end. If you cared specifically about QQP, the leaderboard’s number-one model would mislead you by more than twenty points about how it performs on your task.
ERNIE wins 6 of 8 tasks outright. The two it loses, it loses to T5: RTE and STS-B, the same two tasks where the headline margin already evaporated. So the model that is first on average is genuinely second-best on a quarter of the benchmark, and the average is what buries that.
I will be honest about what did not pan out. I expected the per-task ranks to scramble more than they do. They mostly do not. BERT sits at rank 4 on every single task, RoBERTa at rank 3 on every task, and the LSTM models stay clustered at the bottom. The biggest rank swing belongs to plain BiLSTM, moving from 5th to 8th, a span of three places. The ordering of these eight models is stable because the architecture gap is huge and the models are a generation apart. Rank stability is the boring answer, and it is the real one for this particular field.
But rank stability is exactly the trap. Because the ranks barely move, you would trust the mean, and the mean is decided by margins, not ranks, and the margins are tiny and lopsided. ERNIE and T5 never trade more than two rank positions, yet across tasks their score margin runs from +3.9 on CoLA to -0.2 on RTE. The leaderboard order is robust. The leaderboard winner is not.
What I would actually report
If I had to hand someone one number for this benchmark, I would not hand them the mean. I would hand them the per-task table and point at CoLA’s 63.9-point spread and QQP’s 75.2 ceiling. Those tell you where models still differ and where the benchmark has stopped being able to tell them apart. The 0.7 points between ERNIE and T5 are real, but they live almost entirely in one task. A different weighting, or one more saturated task added to the suite, and that margin closes to a rounding error. When a ranking can be carried by the choice of which already-solved tasks to include, the ranking is not measuring the thing the headline claims.
The snapshot is old and tiny: eight models, one frozen moment. The flattening it exposes is not.