// article
When Coders Commit
The 9-to-5 I went looking for was not in the commits
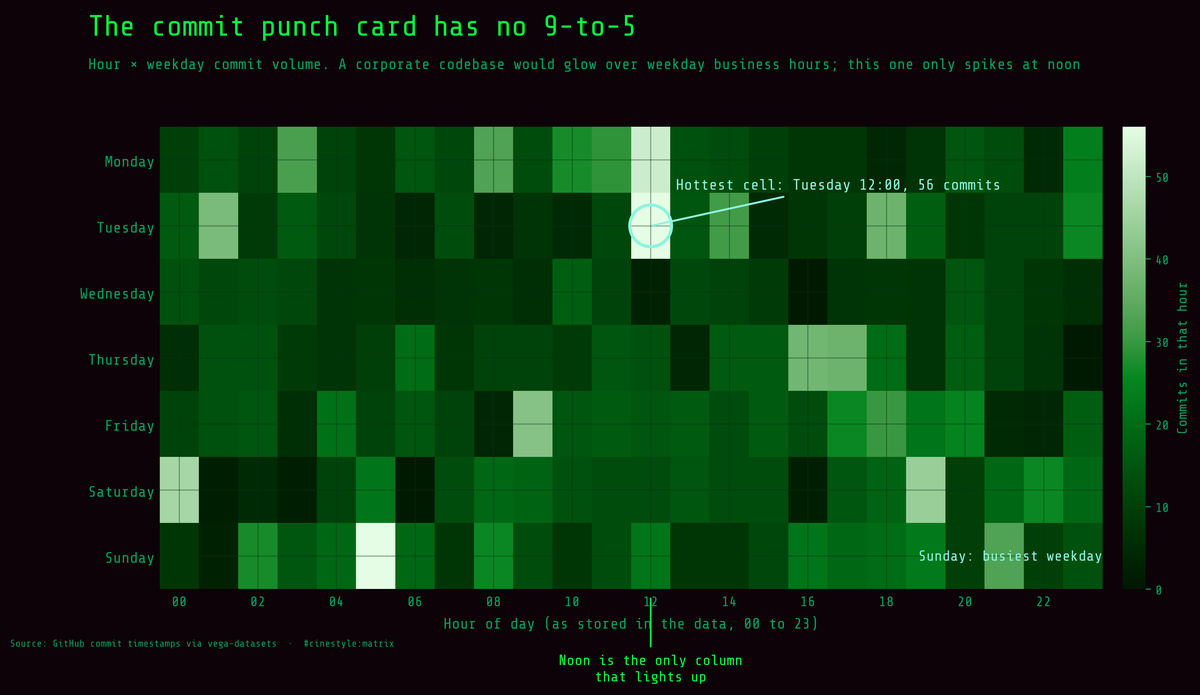
A corporate codebase plotted as an hour-by-weekday punch card glows in a tidy block over weekday business hours and goes near-black overnight and on weekends. This one does not. The only feature that lights up across the room is the noon column, the busiest single cell is Tuesday at noon with 56 commits, and the weekend rows run as warm as the weekdays. The whole article is in that chart.
I expected a heartbeat. Commits pile up Monday through Friday, peak mid-morning, dip for lunch, taper after six, and flatline on the weekend. That is the story everyone tells about developer activity, and I figured a stream of GitHub commit timestamps would hand it to me clean.
It did not. The busiest day of the week in this data is Sunday.
The dataset is 955 hourly buckets of GitHub commit activity from vega-datasets. Each row is a timestamp and a count of commits recorded in that hour. It runs from 2015-01-01 01:00 to 2015-05-30 11:00: 149 days, 150 distinct active dates, 2,479 commits total. Small, but enough to see a rhythm if one exists. So I parsed the hour-of-day and day-of-week out of every timestamp and started counting.
The workday curve is mostly flat
I summed commits by hour of day, expecting a fat hump over business hours and a dead zone overnight. What I got was a nearly level line with one spike.
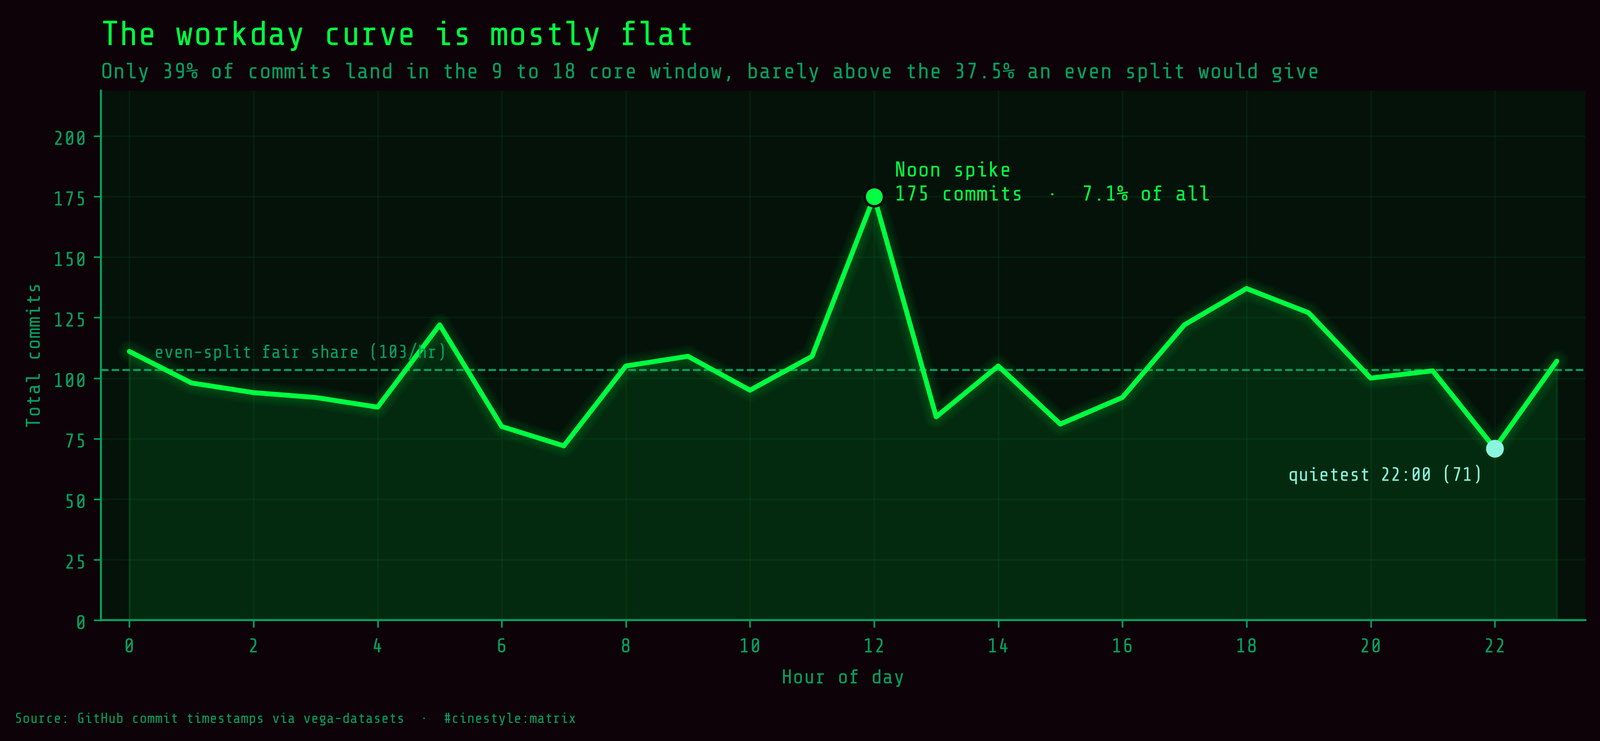
Picture twenty-four buckets, each one waiting for the day’s commits to slosh in. A 9-to-5 stream would overfill nine of them and leave the rest near empty. Here the water sits almost level. Noon is the exception: 175 commits land in the 12:00 hour, the single biggest hour of the day, 7.1% of everything. Step away from that spike and the curve refuses to behave. The 9-to-18 core working window holds only 39.2% of commits, almost exactly what you would expect if commits spread evenly across all 24 hours. Nine of twenty-four is 37.5%, so the working day barely clears its even-split fair share. The quietest hour is not 4 a.m. It is 22:00, with 71 commits, and 5 a.m. (122) outdraws most of the afternoon.
I went hunting for a lunch dip and the data refused to cooperate. The lowest midday hour is not 12:00 or 13:00; noon is the peak. It is 15:00, which sits 17.8% below its neighbors. Squint and that is an afternoon slump, not a lunch break, and at this sample size I would not bet a coffee on it being more than noise.
The overnight trough I was sure I would find is not there either. The 00:00 to 06:00 window carries 24.4% of all commits. Roughly a quarter of the work happens while I assumed everyone was asleep. Whoever or whatever is behind this stream commits at 1 a.m. about as often as at 1 p.m.
The weekend does not collapse, it leads
This is where I re-ran the code to make sure I had not flipped a sort order.
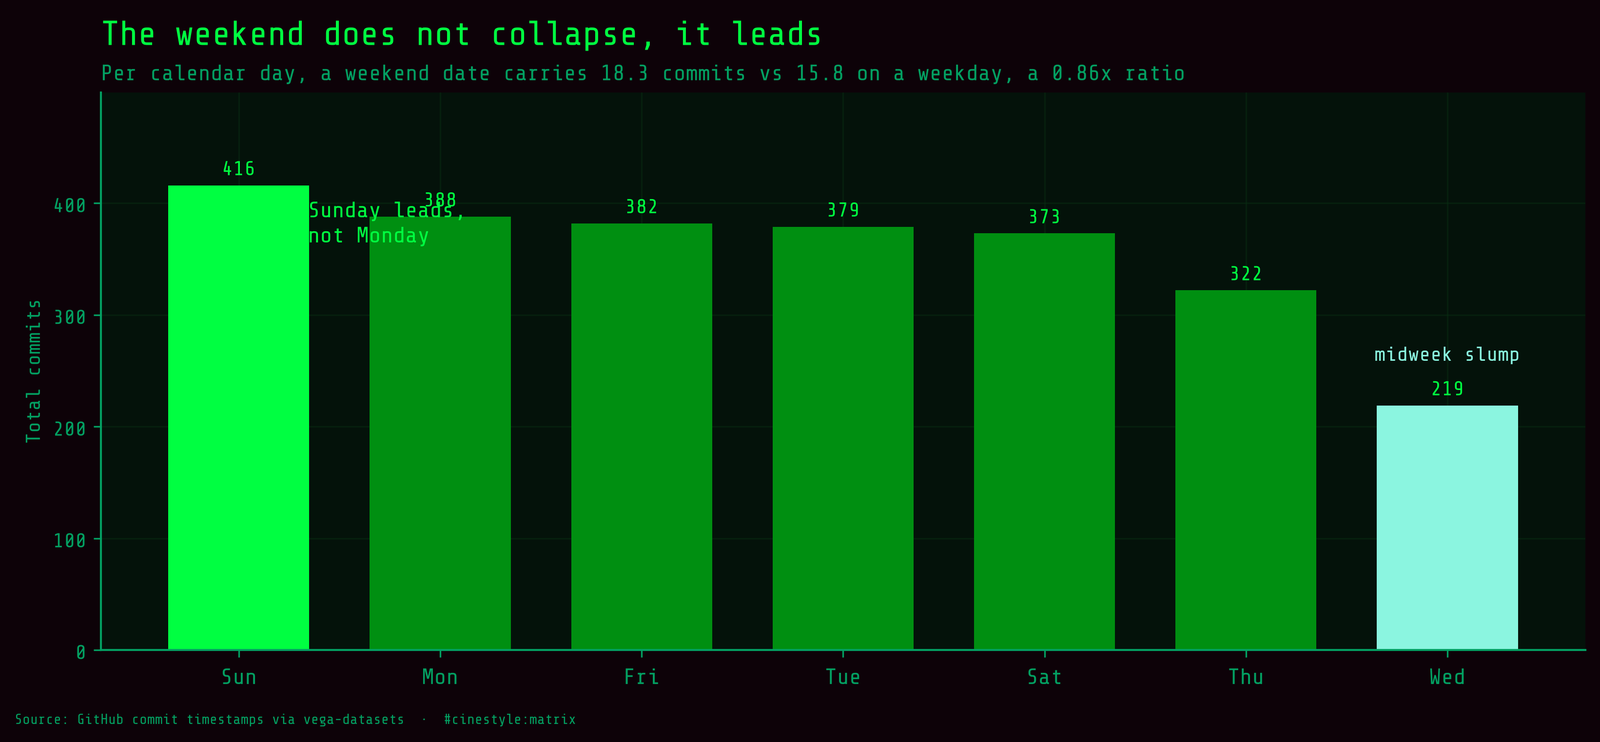
Weekdays hold 68.2% of commits to the weekend’s 31.8%, which at a glance looks like the collapse I expected. But there are five weekdays and two weekend days. The honest comparison is per day. Average it out and a weekday date carries 15.8 commits; a weekend date carries 18.3. The weekday-to-weekend ratio is 0.86. Weekends are busier per day, not quieter.
The single busiest day of the week is Sunday, at 416 commits, edging out Monday (388), Friday (382), Tuesday (379), and Saturday (373). The one genuine slump is Wednesday, which sags to 219, a midweek dip I have no clean explanation for. Thursday recovers to 322. If there is a human work rhythm in here, it is not the office calendar. It looks more like a project people pick up whenever they have a free hour, and free hours cluster on weekends.
The heatmap, and what is off about it
Crossing the two axes gives the chart I wanted from the start: hour of day against day of week, the punch card at the top of this post.
The hottest single cell is Tuesday at noon, 56 commits. That tracks with the 12:00 spike bleeding into a specific day. What strikes me about the heatmap is how little structure it has. A corporate codebase would show a bright block over weekday business hours and near-black corners overnight and on weekends. This one is closer to static, warm patches scattered around with no rectangle. The noon column is the only feature you would point at across a room.
Why I think the story inverted
I cannot see committer identities or time zones in this data, and that is probably the whole explanation. The timestamps are stored as-is. If commits come from contributors spread across the globe, which is the default for an open-source project on GitHub, then everybody’s local 2 p.m. smears across the full 24 hours, and everybody’s local Saturday lands on a different absolute day depending on where they sit. Stack a dozen time zones on top of each other and a flat hourly curve is exactly what falls out. The noon spike might be one busy contributor, an automated job, or an artifact of how the source bucketed the data. From two columns I genuinely cannot tell.
The weekend lead is harder to wave away, but it fits the same frame. Volunteer and side-project work happens off the clock. If this stream leans toward people contributing on their own time, Saturday and Sunday are not dead. They are when the work actually gets done.
A few caveats I am keeping honest about. This is one activity stream, not a representative sample of all of GitHub, so I would not generalize the Sunday finding past this repo. The timezone is whatever the data stored, not anyone’s wall clock, which is enough on its own to dissolve a 9-to-5 pattern. And a commit is a lumpy proxy for effort: one commit might be a typo fix, another a week of work squashed flat. Counting commits tells you when code landed, not when thinking happened.
I came in expecting a weekday pulse with a lunch dip and a weekend collapse. The data gave me a noon spike, a Wednesday slump, and a Sunday that works harder than Monday. Which of those three is a real human rhythm and which is a time-zone illusion? With two columns and no committer IDs I cannot separate them, and that gap is the most honest result in here.