// article
The Dividend Share of Returns
How much of the stock market's return is just dividends
The S&P 500 returns about 9% a year over the long run. Roughly half of that comes from dividends, collected and reinvested, quarter after quarter, in a column nobody puts on the evening ticker. Over 152 years of monthly data, with every payout plowed back in, that quiet half is where most of the money actually came from.
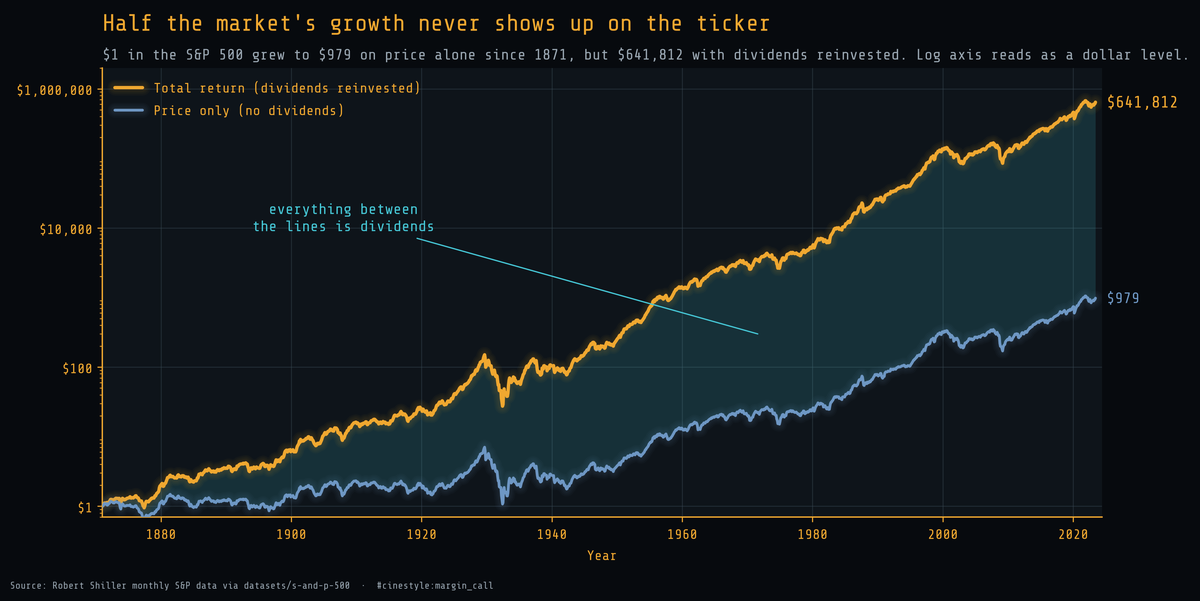
The lower line is a dollar that only rode the price of the index. The upper line is the same dollar with dividends reinvested. The gap between them is the difference between ending with $979 and ending with $641,812, and every bit of that gap is dividends compounding on dividends.
The data is Robert Shiller’s monthly S&P 500 series, 1871 to the present, pulled from the public datasets mirror. It carries price, dividends, and the Consumer Price Index in one table. The feed publishes the price ahead of the slower dividend and CPI numbers, so the last clean total-return month is June 2023. Every era worth discussing happened before then, so nothing of interest is lost.
Two dollars, one starting line
I built two indices from the same starting dollar. The price-only index ignores every dividend and just tracks the level of the S&P 500. The total-return index adds each month’s dividend back in, reinvested at that month’s price, chained from January 1871. Shiller reports a trailing twelve-month dividend, so each month reinvests a twelfth of it. The first dollar is what a price chart shows you. The second is what an investor who reinvested actually held.
On price alone, a dollar in 1871 grew to $979 by June 2023. With dividends reinvested, the same dollar grew to $641,812, about 656 times more. Compounding is unfair to whichever piece you leave out.
Dividends are roughly half the annual return
Annualize both indices and the split is cleaner than the dollar figures suggest. The total-return index compounds at 9.17% a year. The price-only index compounds at 4.62%. Dividends are the 4.55-point gap, which is 49.6% of the total return.
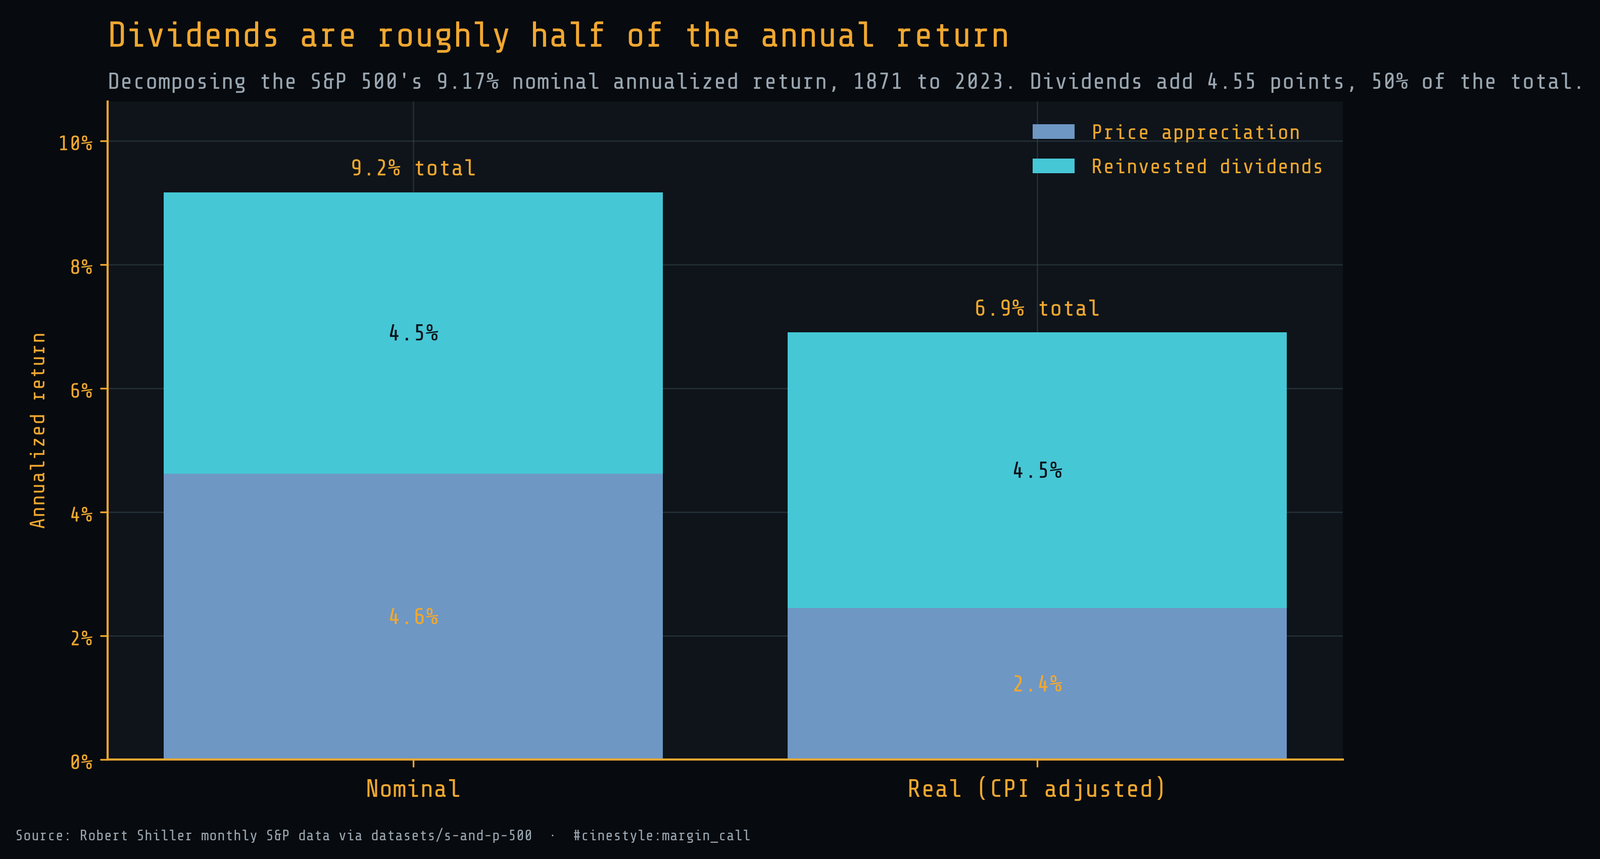
So the famous “stocks return about 9%” is really “stocks return about 4.6% in price and about 4.6% in reinvested dividends.” The two halves are close to even. The dollar gap looks lopsided only because 152 years of compounding turns a 4.55-point annual edge into a 656-fold one. Without dividends, you are looking at a different asset, not a smaller one.
The dividend share was not always half
That fifty-fifty split is a blend of eras that looked nothing alike. Split the record into five and the dividend share of total return falls almost monotonically, from 83.6% in the first era to 21.7% in the last.
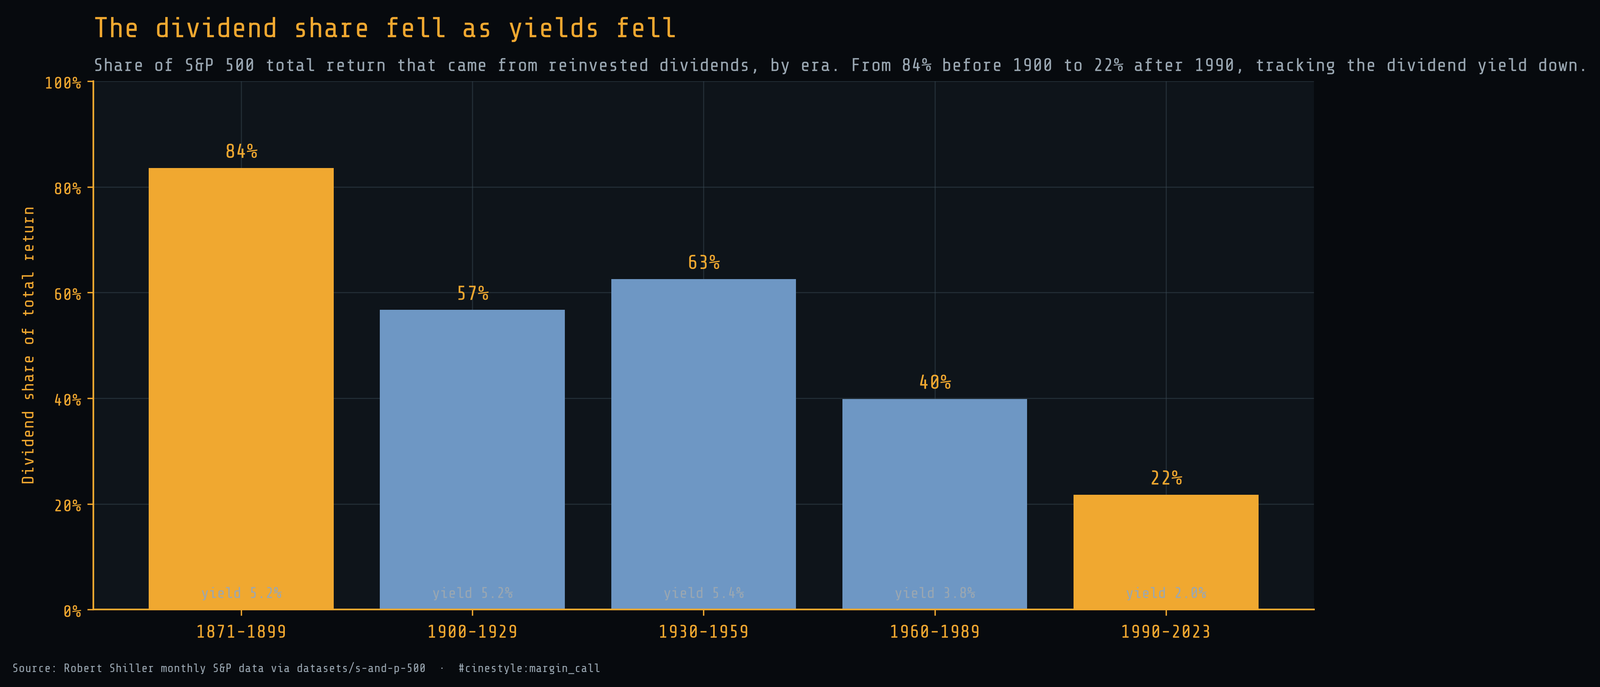
From 1871 to 1899, price went almost nowhere. It compounded at 1.06% a year, and dividends carried 83.6% of a 6.44% total. Stocks then were income instruments first and growth bets second, and the data treats them that way. By the 1990 to 2023 era, price compounded at 7.92% and dividends carried only 21.7% of the total.
The total did not shrink along the way. Total return by era ran 6.44%, 9.89%, 9.08%, 10.27%, and 10.13%, while price growth climbed from 1.06% to 7.92%. The dividend share fell because price took a bigger slice of a steady pie.
The driver is sitting under each bar: the average dividend yield. It held above 5% through the first three eras and then fell, to 3.79% from 1960, to 2.02% after 1990. The usual explanation is that companies shifted cash to buybacks and retained earnings, which this series does not track. The dividend share of return did not collapse because dividends stopped mattering. It collapsed because the yield that feeds it fell from about 5.4% to about 2%.
Inflation eats most of the headline dollar
Every figure so far is nominal, and nominal flatters a 152-year number more than any other trick in finance. A dollar in 1871 bought a great deal more than a dollar in 2023, so the $641,812 is partly real growth and partly the currency shrinking underneath it.
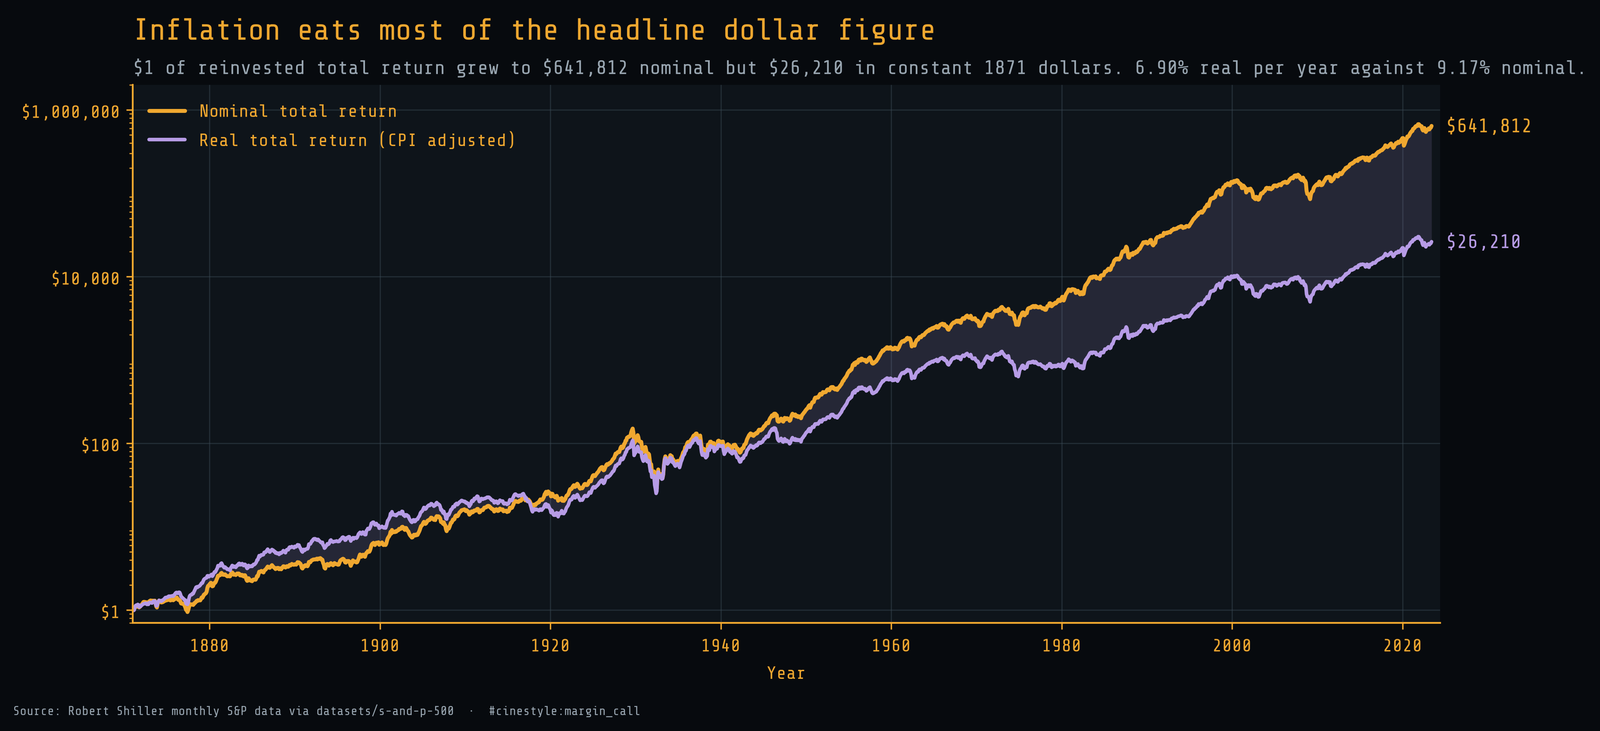
Deflate the total-return index by CPI and the $641,812 becomes $26,210 in constant 1871 dollars. The annual rate falls from 9.17% nominal to 6.90% real. Most of the headline dollar figure is inflation doing what inflation does, and the honest long-run number is the real one.
Inflation also changes the split. In real terms the price-only index compounds at just 2.45% a year, so dividends supply the rest of the 6.90 real points, about two-thirds of the total. A real dollar that rode price alone ends at $39.97. Once you strip out inflation, dividends are not half the return. They are most of it.
A dollar becoming about 26,000 real dollars over a century and a half is still the best broad bet most people will get, just not a $641,812 one.
What the decomposition is actually telling you
I went in expecting dividends to be a footnote, the rounding error you tack onto a price chart for completeness. The data says they are half the building. The price line is the part everyone watches, and in nominal annual terms it is only half the return: 4.62 points against 4.55 for dividends. In real terms it is the smaller part.
That reframes a few things. A backtest run on price alone understates the market by about half its annual return, which over decades is the entire difference between modest and life-changing. These numbers also ignore taxes and fees on the reinvested dividends, which a real investor pays, so treat both indices as upper bounds. An index that has cut its dividend yield from 5% to 2% is now a price story in a way it never used to be, so the next 152 years will not split fifty-fifty. And the only way to capture the dividend half is to reinvest it, which means the receipts go to whoever held on and put the cash back to work, not whoever spent it.
Watch the price if you like, but it is only half the return.