// article
The Pixels That Matter
Twelve of the 64 pixels are dead, and the classifier never misses them
Twelve of the 64 pixels in this dataset have a training variance under 0.5. Three of them never change at all, variance exactly zero across all 1,347 training images. They sit on the left and right edges of the 8x8 box, the columns nobody’s pen reaches. I went looking for them because I wanted to know how lopsided the signal really is. If a fifth of the image is constant, the model is spending weights on nothing.
That one frame is the whole article. Mutual information between each pixel and the digit label, laid back onto the grid it came from. The bright band runs down the middle, the edges go dark, the twelve dead pixels are crossed out, and the twenty ringed pixels are the ones that reach 92.9% test accuracy on their own. The corners never had a vote.
The data is sklearn’s bundled UCI Optical Digits set: 1,797 samples, each an 8x8 grayscale image flattened into 64 pixel columns, ten digit classes. Every pixel is an integer from 0 to 16. The columns are named by position, so pixel_4_2 is row 4, column 2, which makes it easy to put a number back onto the grid it came from. I split 1,347 train and 450 test, stratified, seed fixed at 42, and computed everything that touches the label on train only. All accuracies below are test set.
The edges are constant, and you can prove it pixel by pixel
Variance per pixel is the cheapest diagnostic there is, and it tells the whole story before any classifier runs. I reshaped the 64 variances back into an 8x8 grid:
The left panel is variance. It is dark down the left and right columns and bright through a vertical band in the middle. The right panel is mutual information between each pixel and the digit label, and it lines up with the variance almost perfectly. A dead pixel carries no information because it never moves.
The dead pixels cluster on the left and right edges, eight in column 0 and four in column 7. Widen the threshold to variance under 1.0 and you reach 17 dead pixels, more than a quarter of the image. A pen drawing a digit into a centered 8x8 box cannot reach the outer columns, so those pixels sit at zero ink and stay there. Mutual information for the deadest pixel is exactly 0.0. For the best one it is 0.4306. That is the spread the model is working with.
How few pixels do you actually need
If the information is concentrated, a handful of pixels should recover most of the accuracy. I ranked all 64 by mutual information and trained the same logistic regression on just the top k, standardizing on train statistics each time. Walking k up:
- 1 pixel: 22.9%
- 2 pixels: 40.2%
- 5 pixels: 61.1%
- 10 pixels: 82.4%
- 15 pixels: 89.6%
- 20 pixels: 92.9%
- 30 pixels: 94.9%
- all 64 pixels: 97.8%
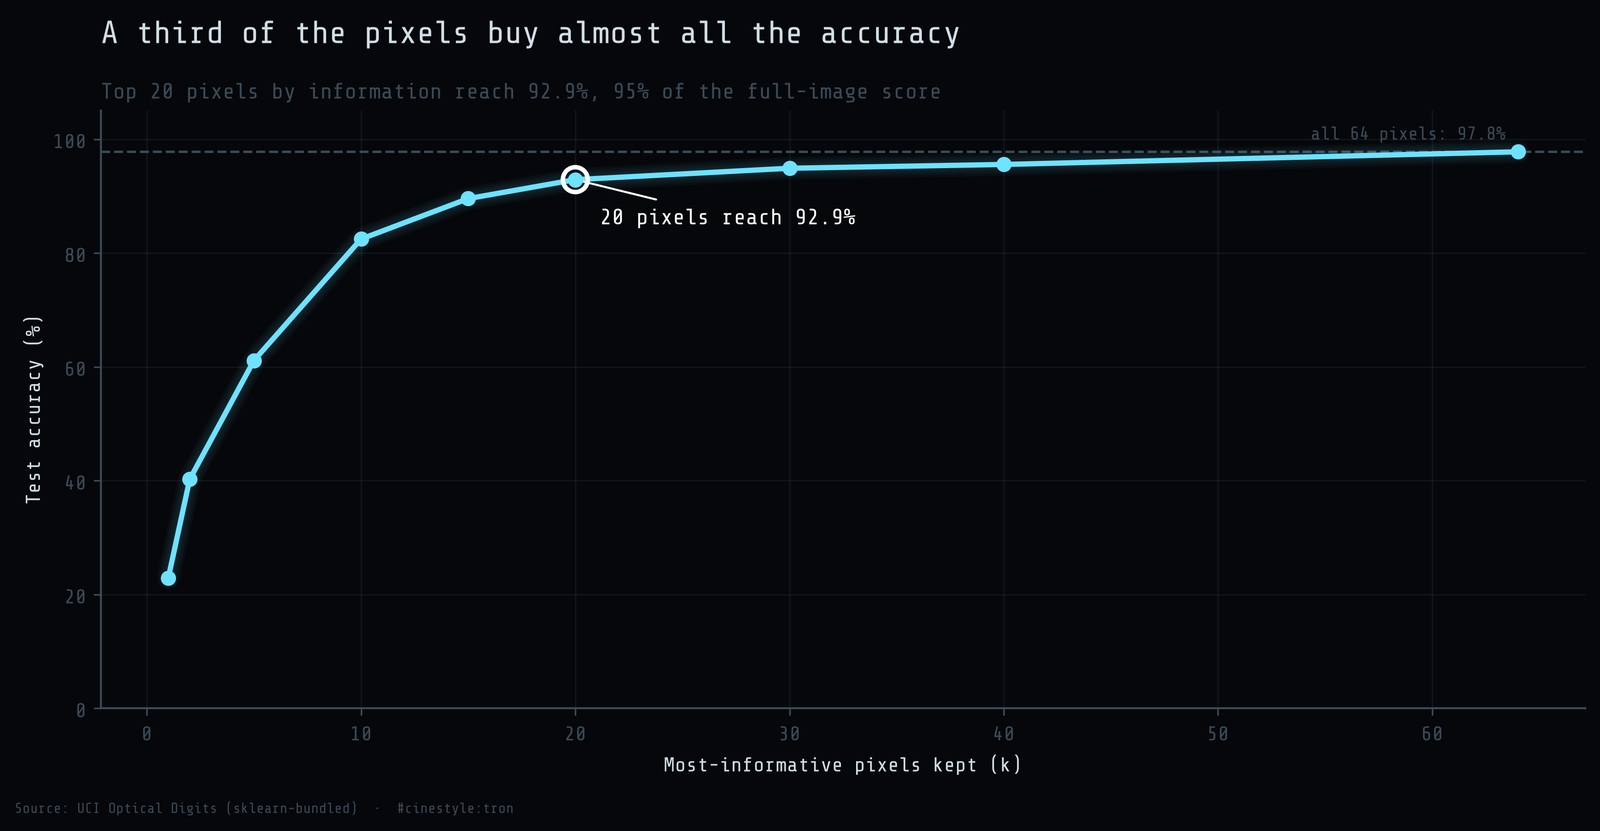
Twenty pixels, fewer than a third of the image, get you to 92.9%, which is 95% of the full-pixel accuracy. The remaining 44 pixels, more than two-thirds of the data, buy you the last 4.9 points. The curve is steep early and flat late, exactly what you would predict from a variance map that is bright in the middle and dark at the edges. The single most informative pixel alone, with nothing else, classifies one image in four correctly against a 10% random baseline.
I will flag the honest part of that top-1 number. 22.9% from a single intensity value sounds almost too good, but this is a ten-class problem where one pixel can rule out half the digits, not nail one. It is a coarse filter, not a classifier.
The most informative pixel sits on the left edge, and it is a 6-detector
The winner is pixel_4_2, row 4, column 2, the left-middle of the grid, mutual information 0.4306. It carries the brightest ring on the flagship. To see what it is doing I pulled the mean intensity of that pixel per digit on the train set, and the split is clean. It is bright for 6 (mean 14.6 out of 16), 4 (14.4), and 0 (11.3), the digits with a heavy left stroke or a closed left loop. It is nearly dark for 2 (1.2), 3 (1.2), and 9 (3.0), digits that leave the left-middle empty because their ink lives on the right or the top. One pixel cleanly separates the left-heavy digits from the right-heavy ones. It does not detect one digit. It slices the ten classes roughly in half along a stroke that is either there or it is not.
That single split is the seed of the whole accuracy curve. Stack a dozen more pixels that each carve the space along a different stroke and you have the structure of a digit without ever touching the edges.
The caveat that matters
This is not MNIST. These are 8x8 thumbnails, 64 pixels, and the reason the edges are dead is partly that the resolution is so low the ink has nowhere to spread. At 28x28 the dead-pixel fraction would shrink and the most informative locations would move, because a higher-res pen reaches more of the frame. So do not read “a quarter of the pixels are useless” as a property of handwritten digits in general. Read it as: at this resolution, with the digit centered, the signal collapses onto a vertical band and the perimeter is free to throw away.
What I would take from it for any low-res glyph problem: compute per-pixel variance first, before you reach for a model. It costs nothing and it tells you how much of your input is constant. Here it told me a fifth of the image was dead weight and the middle third was carrying almost everything. The classifier confirmed it, recovering 95% of its accuracy from 20 pixels it picked off a mutual-information ranking. The corners never had a vote to begin with.