// article
Recognizing Digits
Twenty numbers per digit gets you 94% of the way there
Twenty principal components get you 94.2% test accuracy on handwritten digits. The full 64-pixel image gets you 97.8%. That gap, three and a half points, is what more than triple the dimensions buys you. I ran the experiment because I keep seeing people reach for a convnet on problems this size, and I wanted to know what the floor actually looks like.
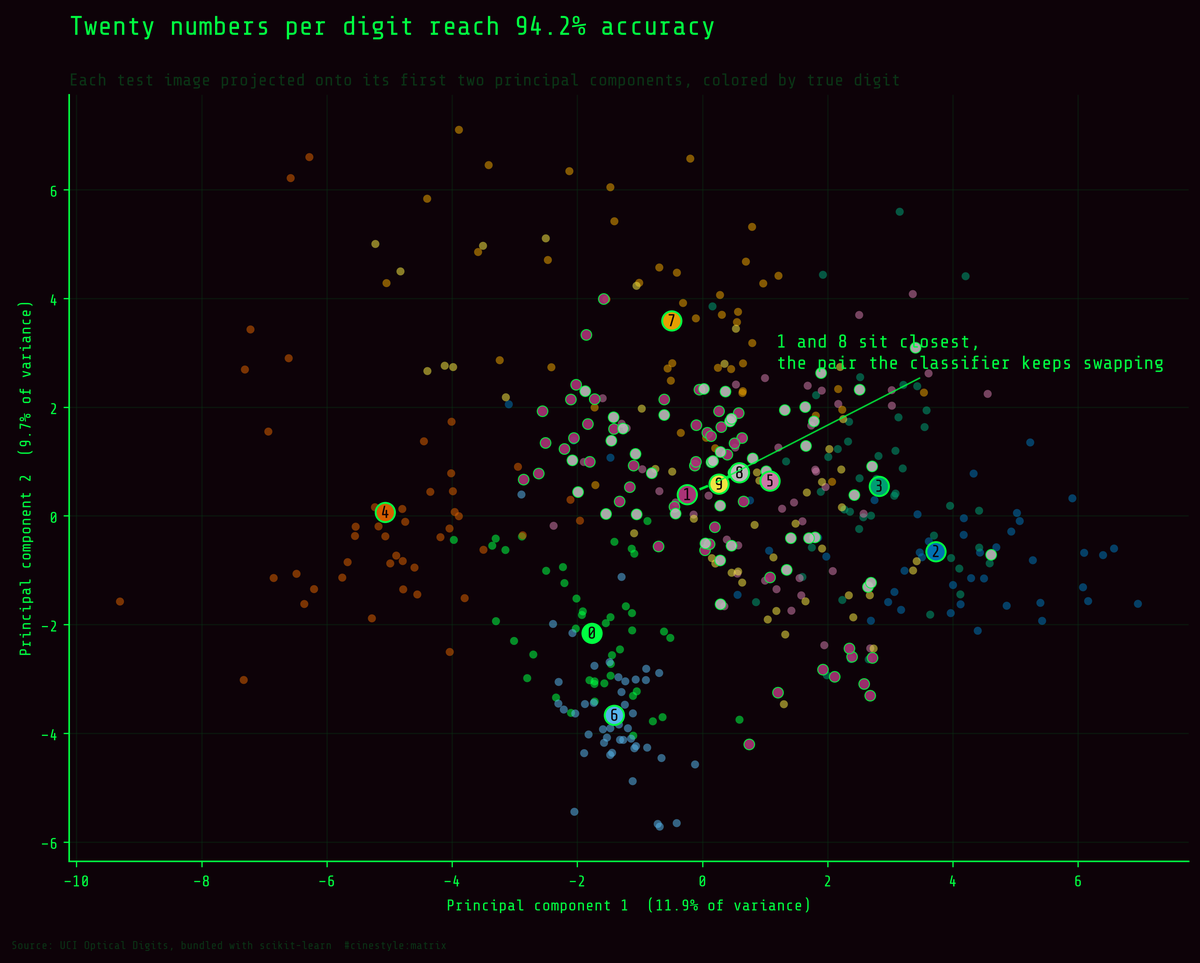
Project every test image onto its first two principal components and the structure is already visible. Most digits pull apart into their own territory. The centroids for 1 and 8 sit closer than any other pair, and that proximity is exactly where the model’s errors come from. Two components reach only 51% accuracy, but they hold enough of the picture to predict the confusion matrix before you train a thing.
The data is sklearn’s bundled UCI Optical Digits set: 1,797 samples, each an 8x8 grayscale image flattened into 64 pixel columns, ten classes, roughly 180 examples per digit. It is tiny. Each pixel is an integer from 0 to 16. I split 1,347 train and 450 test, stratified by digit, fixed the seed at 42, and standardized using train statistics only so PCA and the classifier never see the test set. Everything below is test-set accuracy unless I say otherwise.
The baseline overfits, and it does not matter
Plain logistic regression on all 64 standardized pixels hits 100.0% on train and 97.8% on test. So yes, it memorizes the training set perfectly. With 1,347 rows and 640 weights (64 pixels times 10 classes), that is not shocking. But the test number holds up, so the memorization is not costing much. I almost did not report the train number because it looks alarming in isolation. The honest read: a linear model on raw pixels is already near-ceiling for this dataset, and a 2.2-point test error is most of what is left to win.
That reframes the whole exercise. The interesting question stops being how to get more accuracy and becomes how cheap I can make this before it hurts.
Most of the 64 pixels are dead weight
PCA answers that directly. Run it on the standardized training pixels and look at cumulative explained variance.
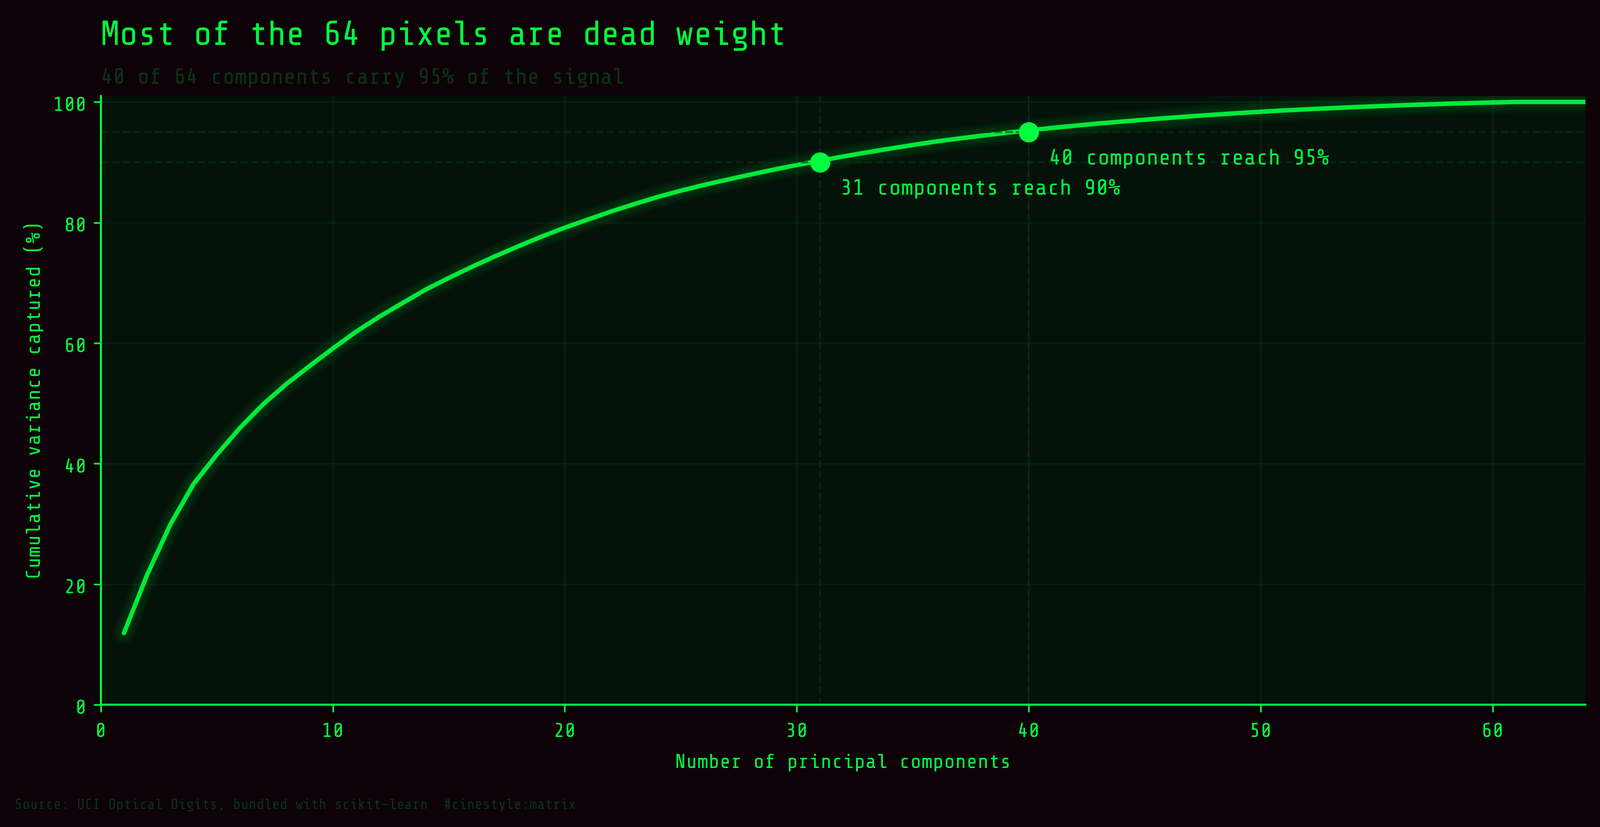
You need 31 components to capture 90% of the variance and 40 to reach 95%. That sounds like a lot until you remember the corners. In an 8x8 digit the outer ring of pixels is almost always zero. Nobody writes a 7 into the top-left corner, so a chunk of those 64 dimensions carry no signal at all. The variance is real but it spreads thin across the back half of the spectrum, the part that is mostly noise and edge jitter.
Here is the payoff. I trained the same logistic regression on the top-k components and walked k down.
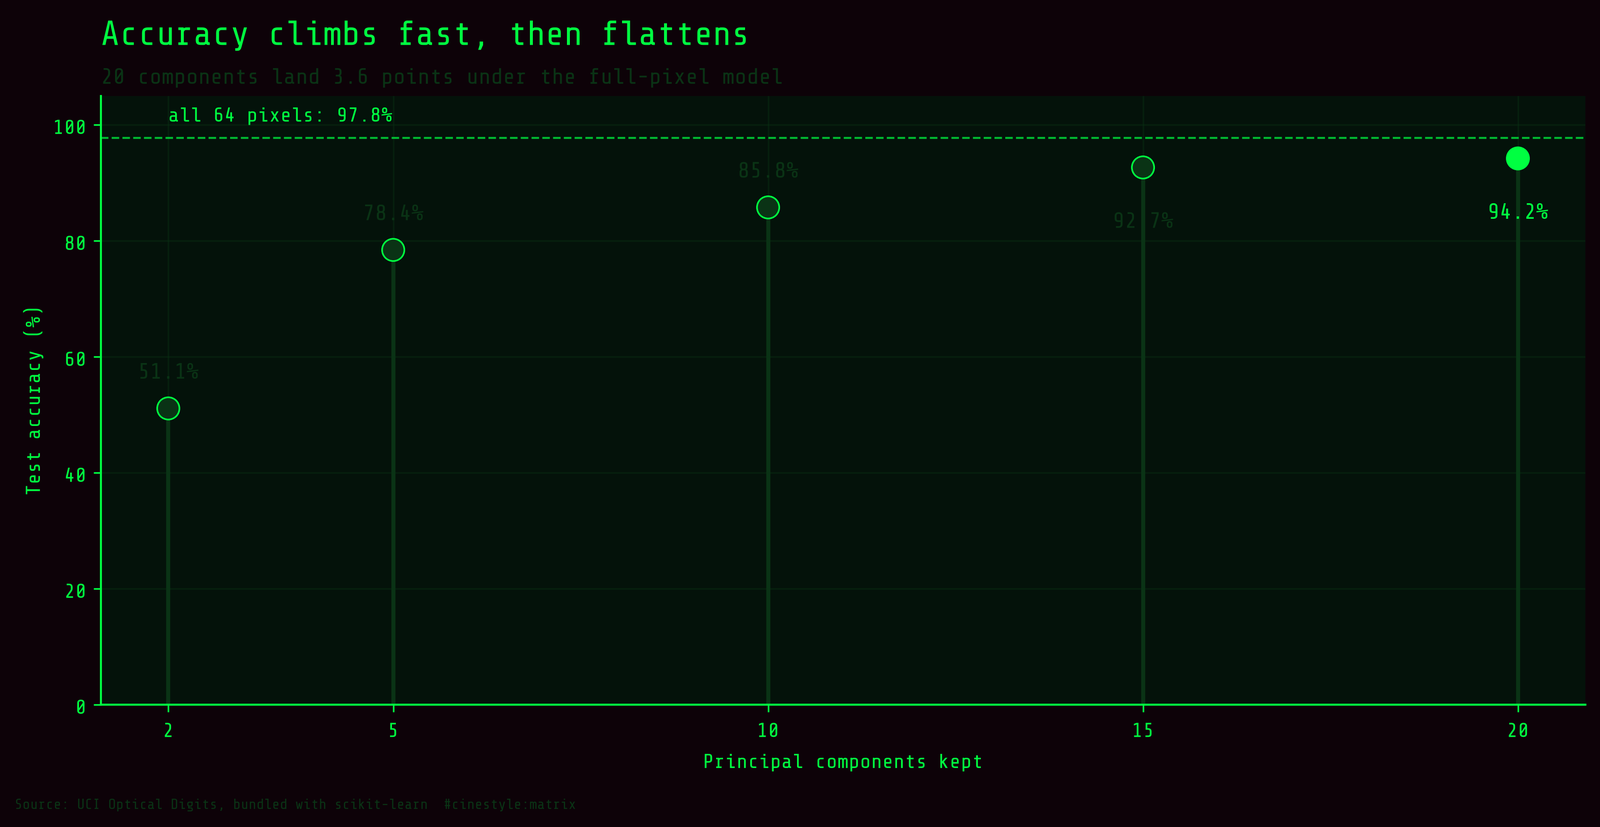
- 2 components: 51.1%
- 5 components: 78.4%
- 10 components: 85.8%
- 15 components: 92.7%
- 20 components: 94.2%
Twenty numbers per image and you are within 3.6 points of the full-pixel model. Forty components, the 95%-variance cut, gets you to 96.0%, and that model overfits less than the baseline: a train/test gap of 3.8 points instead of a memorized training set riding under a 2.2-point test error. The complexity-by-default instinct says throw all 64 pixels at it. The data says the last 44 components buy you less than two points.
What actually gets confused
So I took the 40-component model, my best small model at 96.0% test, and looked at where its 18 test errors land.
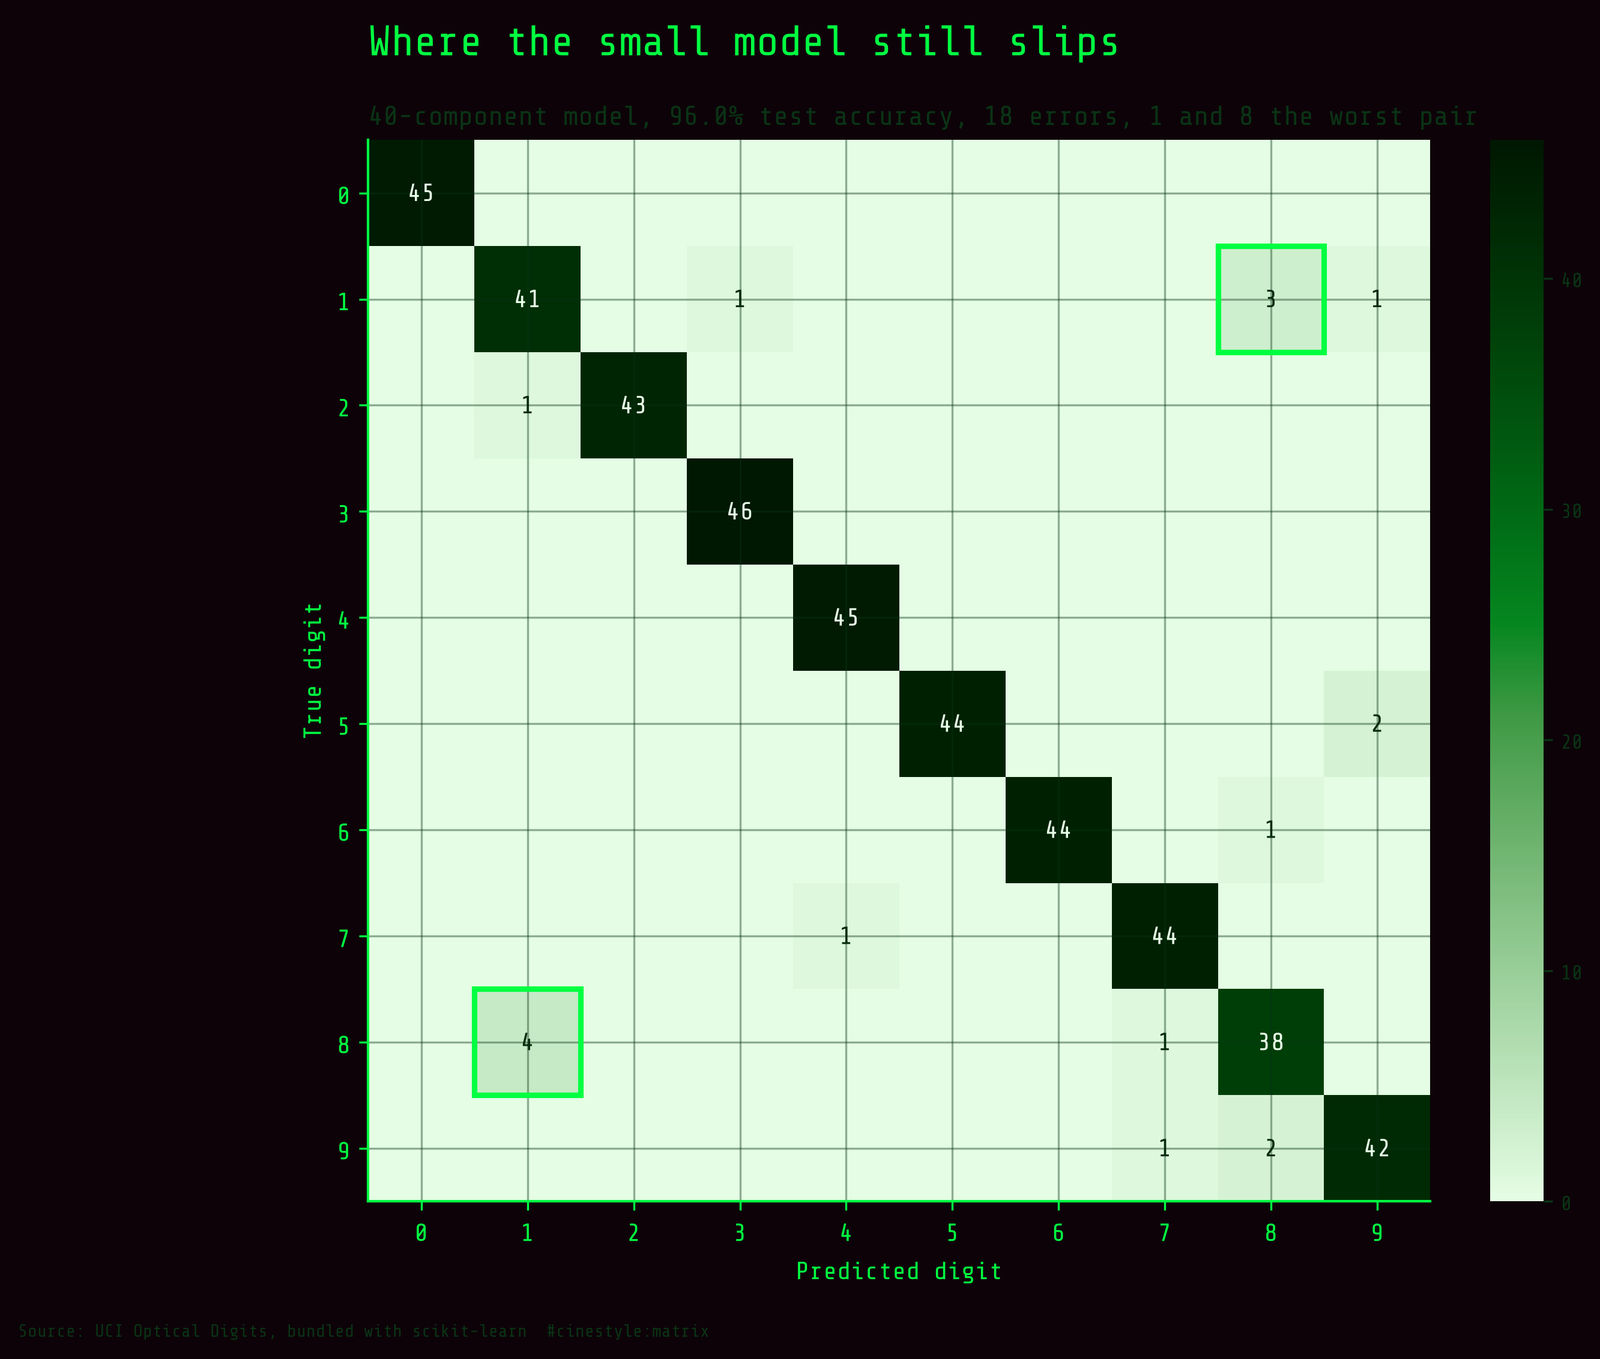
The single worst pair is 1 and 8. Across both directions they are swapped 7 times, and the most common single mistake is a true 8 read as a 1, four times. I expected the classic 3/5/8 mush, and it does show up, but 1 versus 8 beating it was the surprise that made me re-check the matrix. At 8x8 resolution it makes sense once you see it. A thin or open 8 collapses toward a vertical stroke, and there are not enough pixels to keep the two loops of an 8 distinct from the single line of a 1. The resolution is the bottleneck, not the model.
That is the caveat I will put a flag on. This is not MNIST. These are 8x8 thumbnails, 64 pixels, and a lot of the hard cases are hard because the image is too small to resolve, not because the classifier is too simple. A 28x28 digit would split the 1/8 tangle that this resolution cannot. Do not read “linear model wins” as a universal law. Read it as this: at this resolution the information ceiling is low enough that a linear model on a fifth of the dimensions sits right under it.
If you are shipping something that classifies low-res glyphs, start with PCA to twenty-ish components and logistic regression, measure, and add capacity only when the confusion matrix names the pair costing you. For this dataset that pair is 1 and 8, and no amount of extra pixels you do not have is going to fix it.