// article
What Makes Great Coffee
What actually makes a great cup of coffee
A trained taster scores a coffee on ten things and adds them up. The total runs from about 60 to 90 on a 100-point scale, and most graded lots land between 80 and 84; the mean is 82.15 with a standard deviation of 2.69. Inside that narrow band, a handful of the ten components do nearly all the separating, and three of them do almost none. The Coffee Quality Institute has graded thousands of lots this way, and the public TidyTuesday cut of that record is enough to see which parts of the score are load-bearing.
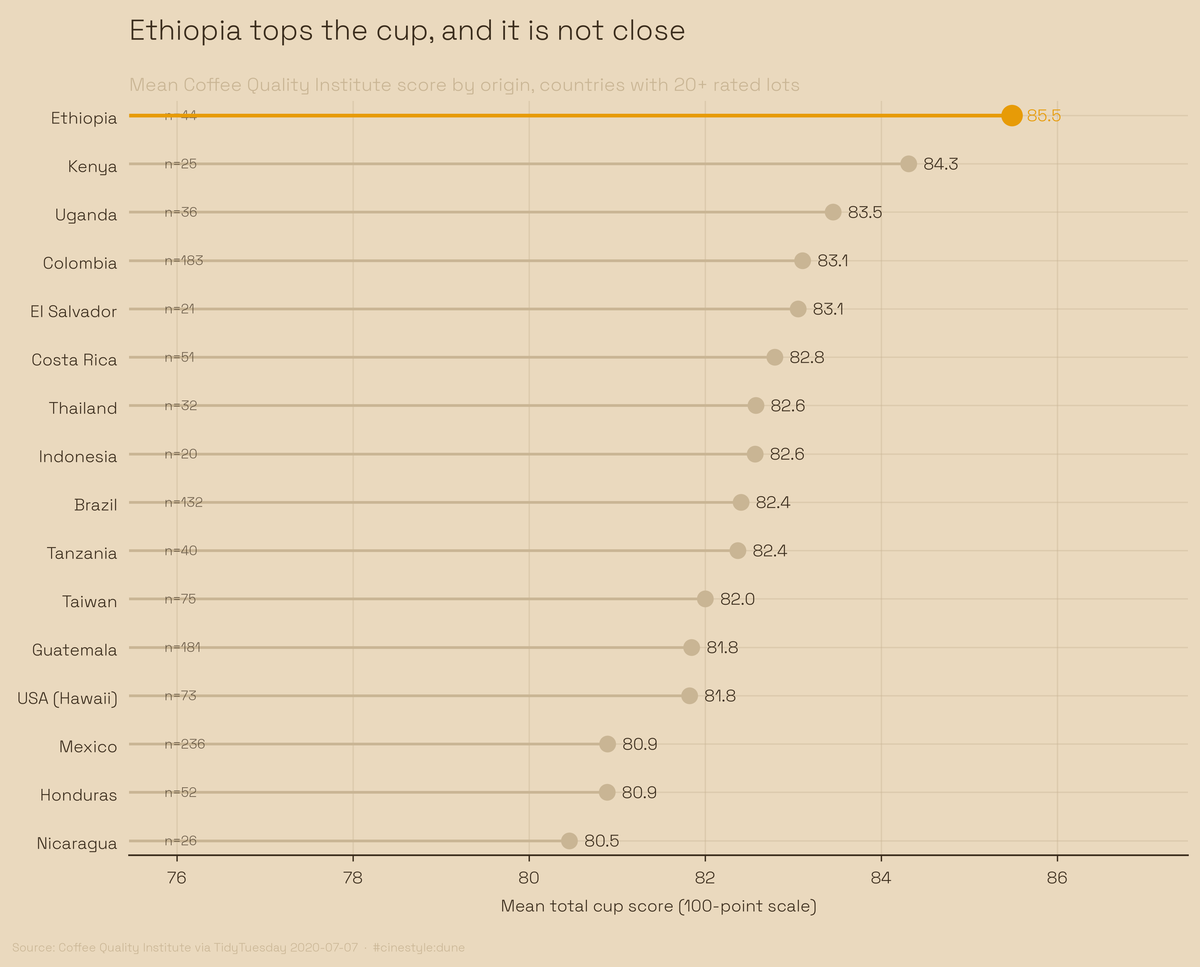
Origin matters, the spread from top to bottom is real, and the order is not the one a supermarket shelf would predict.
The data is 1,339 rated lots. One row scores zero on every component, which is a missing grade and not a catastrophic coffee, so I dropped it and worked with the remaining 1,338. The total cup score runs from 59.83 to 90.58. Everything below comes from that table and nothing else.
The score is mostly flavor, and partly a formality
Each lot carries ten component scores: aroma, flavor, aftertaste, acidity, body, balance, uniformity, clean cup, sweetness, and the cupper’s own points. They sum to the total. The obvious question is which ones move it.
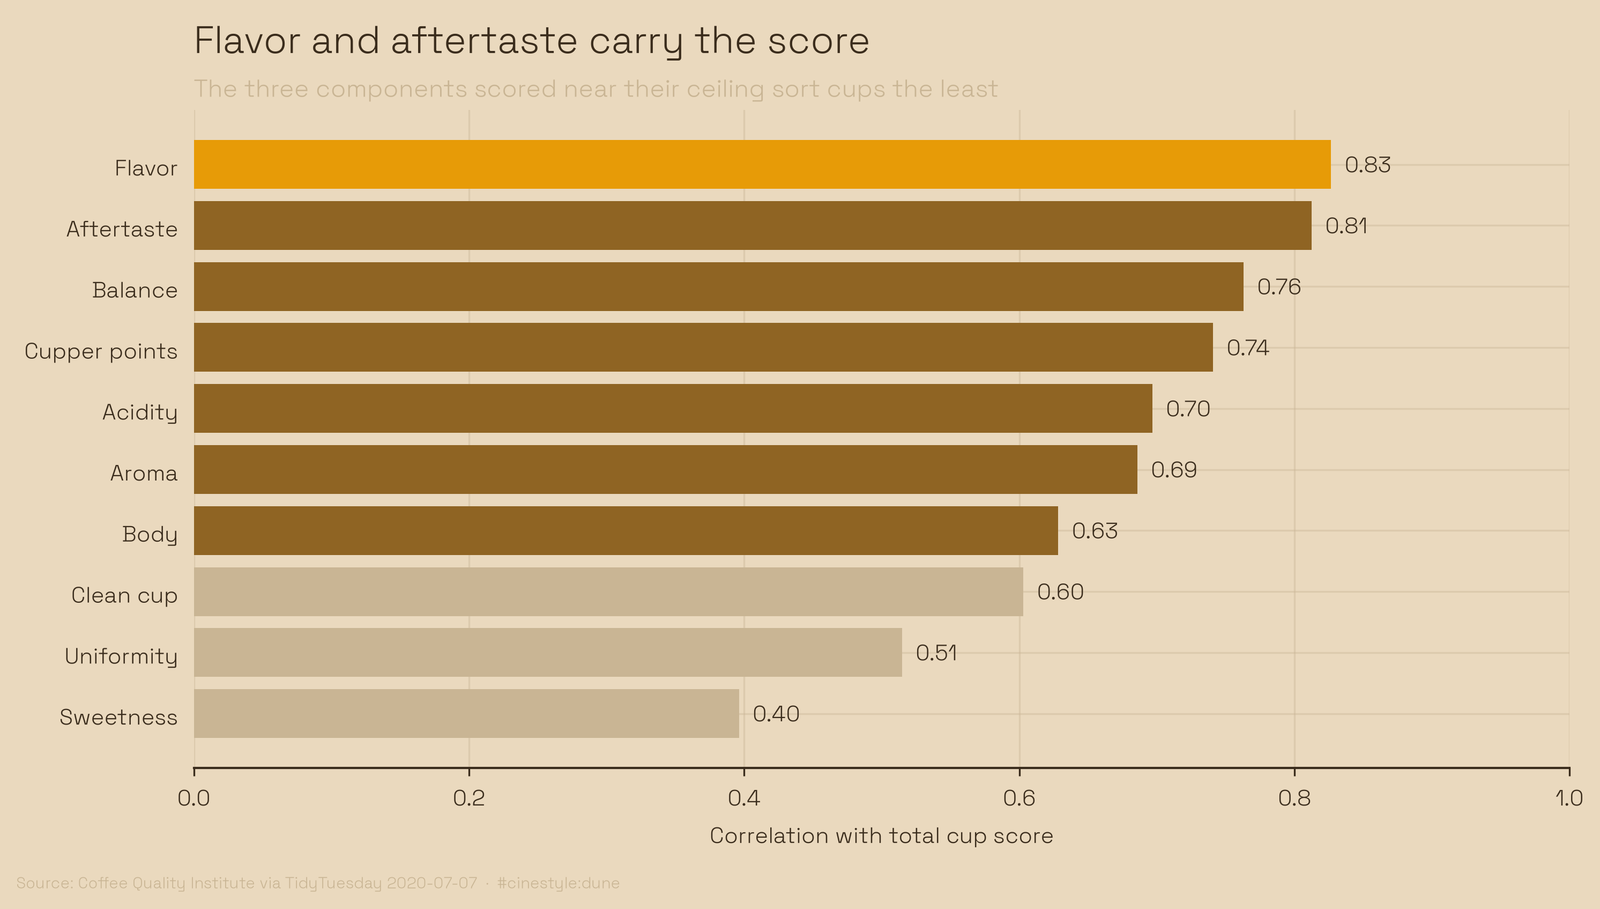
Flavor correlates with the total at 0.83, aftertaste at 0.81, balance at 0.76. Those three are the spine of the score. Sweetness sits at the bottom at 0.40, and uniformity at 0.51. One caution on reading these: every component is part of the total it is correlated with, so each correlation is inflated by construction. The inflation is largest for the components with the widest spread, and clean cup, the widest of all, still ranks near the bottom, so the ranking is not an artifact of that bias.
Sweetness, uniformity, and clean cup are scored on the same 10-point scale as the rest, but almost every coffee in the set earns close to a perfect mark on them. Their means are 9.86, 9.84, and 9.84, against roughly 7.5 for the sensory components. Their spread is not smaller, though. The standard deviations are 0.55 for sweetness, 0.49 for uniformity, and 0.72 for clean cup, against 0.31 to 0.35 for flavor, aroma, and balance. That spread comes from the rare lot that fails the check, not from shades of quality among the lots that pass. These three behave like a pass-fail checkbox that almost everything passes. They count toward the total but rarely decide it; flavor does.
Origin is the biggest lever in the data
Group by country, keep the ones with at least twenty rated lots so a single farm cannot swing the average, and the ranking in the lead image appears. Ethiopia tops it at 85.48 across 44 lots. Nicaragua anchors the bottom at 80.46 across 26. That is a 5.03-point spread, which is nearly two standard deviations of the whole score distribution.
Ethiopia and Kenya, the two East African origins at the top, are also the genetic home of arabica. Colombia and Costa Rica, the Latin American names a Western drinker knows best, sit in the upper middle. Mexico is the largest single contributor to the set with 236 lots and lands near the bottom at 80.89.
Read the sample sizes before you read too much into any one row. Kenya’s 84.31 rests on 25 lots and Nicaragua’s 80.46 on 26, both barely over the floor of twenty. Ethiopia’s 44 lots are a thinner sample than Mexico’s 236, and a country graded by one importer’s pipeline is not a census of its coffee. The order is suggestive, not a verdict on national terroir. Still, when the gap from top to bottom is two standard deviations wide, origin is the largest single thing in this dataset that you can point at.
Processing barely moves the needle
Coffee gets dried in different ways. Washed, where the fruit is stripped before drying. Natural, where the bean dries inside the fruit. Honey and semi-washed methods that split the difference. Enthusiasts will argue about these for an hour.
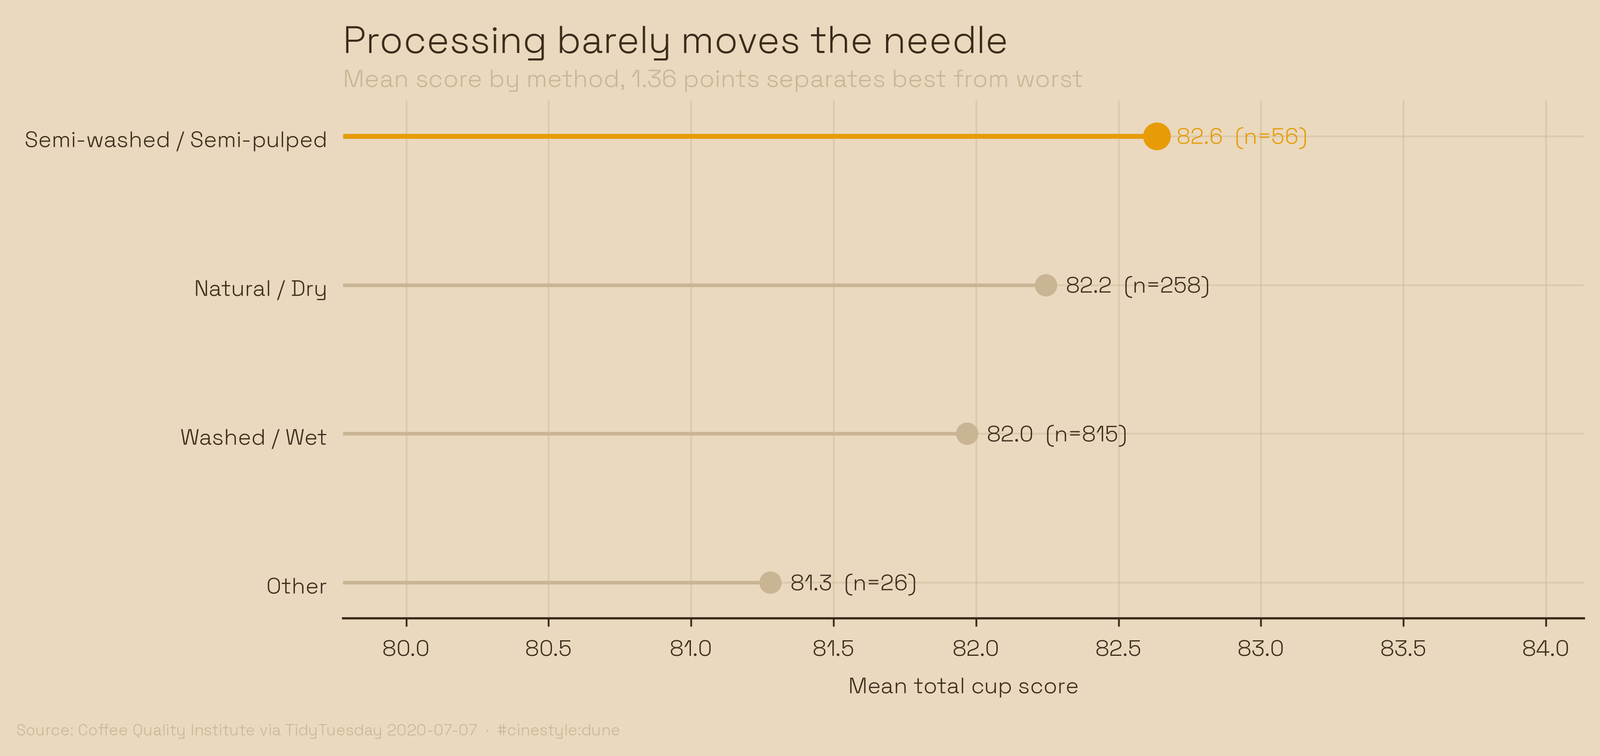
The data is unimpressed. Semi-washed lots average 82.63, the catch-all Other category averages 81.28, and everything sits in between. The full spread from best method to worst is 1.36 points, roughly half a standard deviation, and the n=56 semi-washed sample at the top is small enough that I would not bet on it holding. 169 lots never recorded a method, so this is a partial picture. Washed and natural, the two methods that actually carry volume at 815 and 258 lots, are separated by a quarter of a point. Whatever processing does to the cup in your mug, it is not what sorts the graded score.
Altitude helps, after you throw out the impossible numbers
The altitude field is a mess. It is free text that someone parsed into meters, and the parser believed everything. The maximum value in the column is 190,164 meters, which is twenty times the height of Everest and almost certainly a farm that wrote “1901.64” with the decimal in a place the parser misread. Another lot claims 110,000 meters. Coffee grows roughly between sea level and 3,000 meters, so I kept that band and dropped the 16 lots outside it.
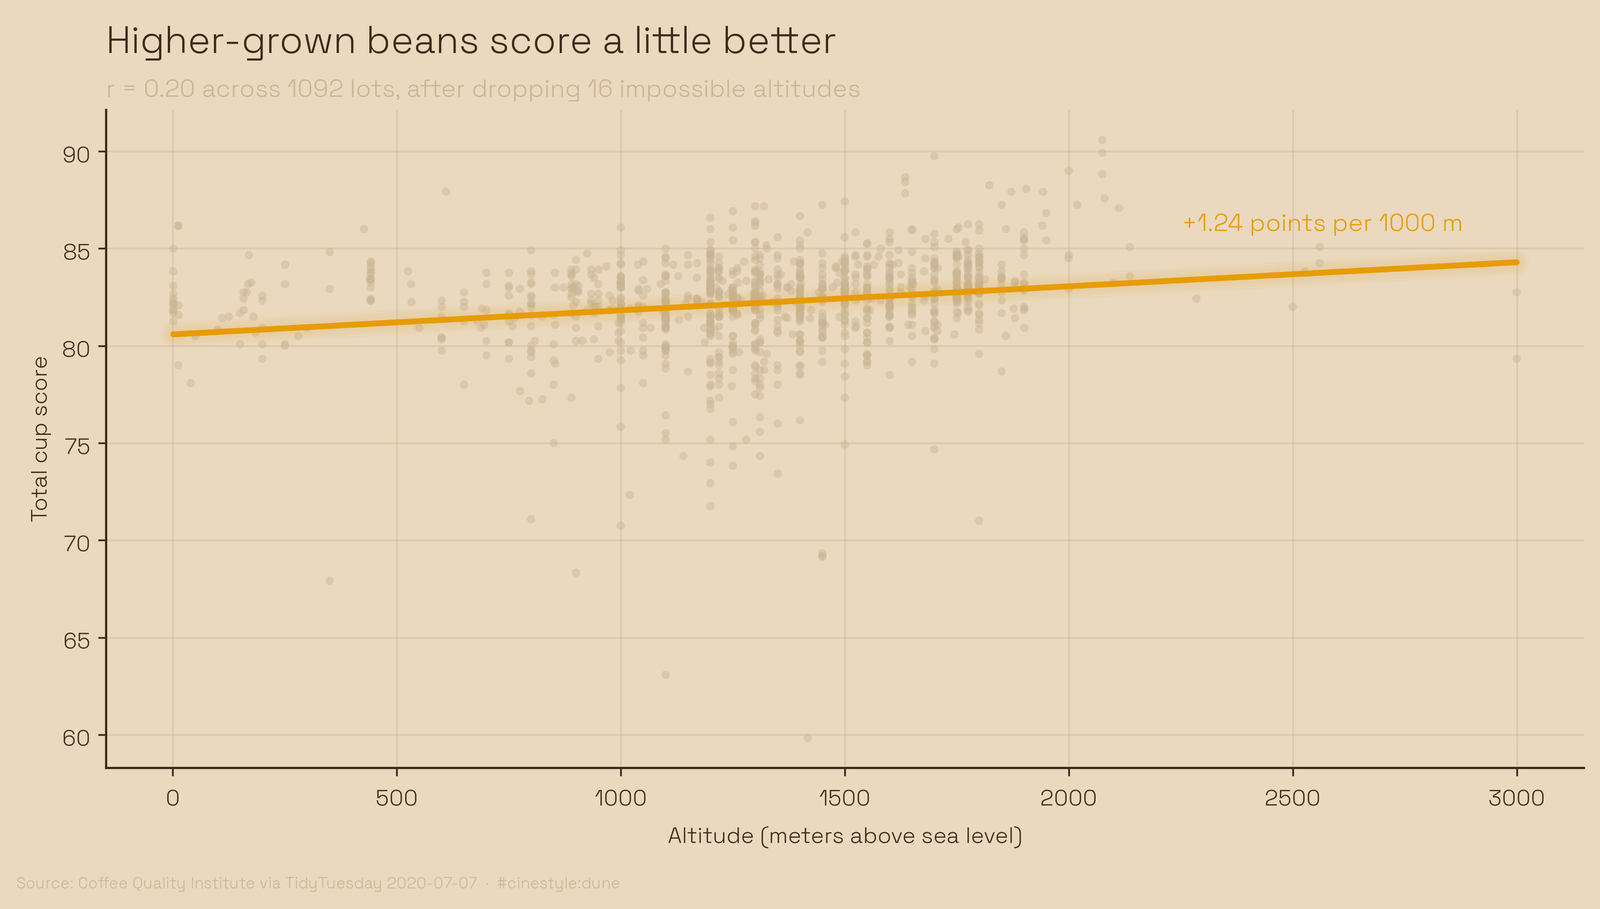
What is left is a real but gentle effect. Across 1,092 clean lots, score and altitude correlate at 0.20, and the fit line climbs about 1.24 points per 1,000 meters of elevation. That direction matches the trade folklore: cooler, higher slopes ripen the cherry slowly and concentrate the sugars. The effect is also small. A thousand meters of mountain buys you a point and a quarter, less than half a standard deviation, and the scatter around the line is enormous. Altitude is a thumb on the scale, not the scale.
Arabica and robusta, with a sample-size asterisk
The set is 1,310 arabica lots and 28 robusta. Arabica averages 82.18, robusta 80.87, a gap of 1.31 points in arabica’s favor. That matches the species’ reputation, but 28 robusta lots is a thin reed, and these are robustas that someone bothered to submit for specialty grading. The everyday instant-coffee robusta is not in this room. Take the gap as consistent with the conventional wisdom and far too small a sample to settle it.
What the cup actually rewards
I came in expecting processing and species to be the story, because that is what the coffee internet argues about. The data put both near the bottom of the list. What moves the graded score is flavor and aftertaste first, origin second, altitude a distant third, and the three near-perfect components not at all. Grow it high, grow it in Ethiopia, and make sure it tastes good; in this data the rest is rounding.