// article
Who Emits the Carbon
Who actually emits the carbon, and the answer depends on how you count
The country that emits the most carbon and the country that emits the most carbon per person are not the same country, and they are not close. In 2024, China put out 12,289 million tonnes of CO2, a third of the world total. Qatar put out 126. But spread those numbers across the people who live there, and Qatar emits 41 tonnes a head while China emits 9. Pick the wrong denominator and you get the wrong villain.
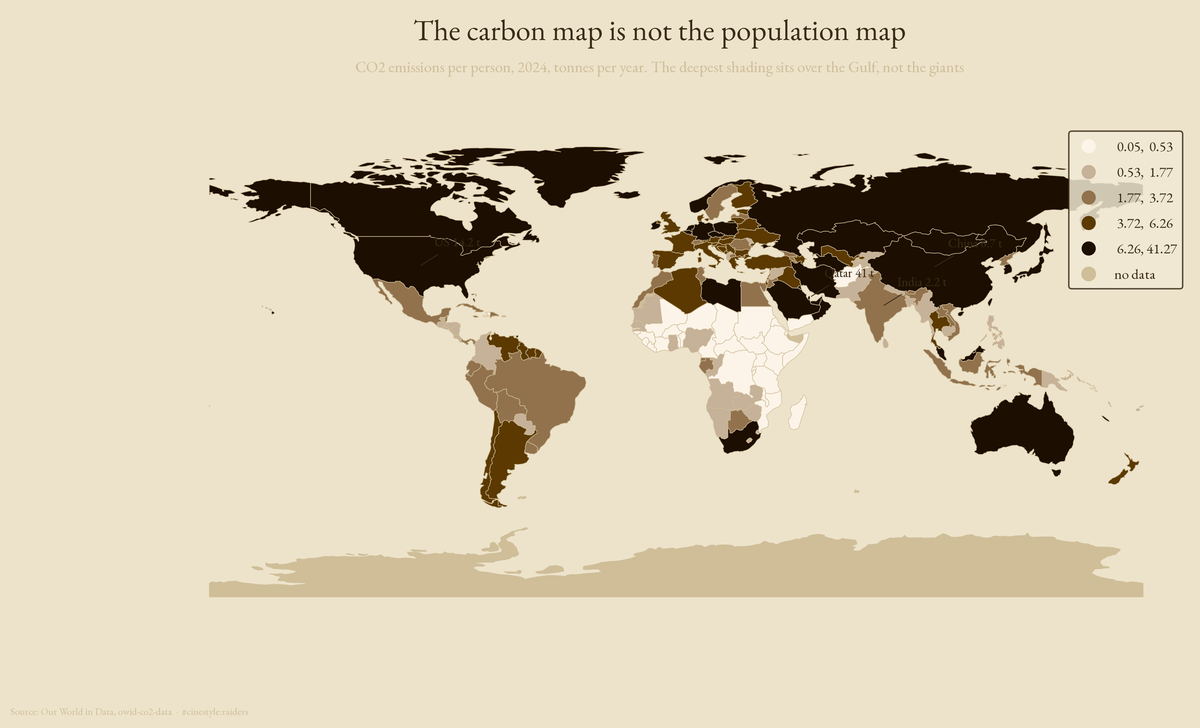
The map shades every country by how much carbon each resident emits. The heavy color sits over the Gulf, not over the giants.
The data is the Our World in Data CO2 record: per country, per year, fossil emissions in million tonnes and tonnes per person, going back to 1750. I kept the latest full year, 2024, and the 215 countries with a real ISO code and a real emissions figure. The world and regional aggregates carry a null code, so dropping them is one line.
The flip: biggest total, ordinary per head
China leads the total by a wide margin. It emits 97.7 times what Qatar does. On the per-person axis the ranking inverts: Qatar emits 4.8 times what China does, and 9.0 times the world average of 4.6 tonnes. The United States sits between the two stories. It is the second-largest total at 4,904 million tonnes, 13.1 percent of the world, and at 14.2 tonnes a head it emits well above China but a third of Qatar.
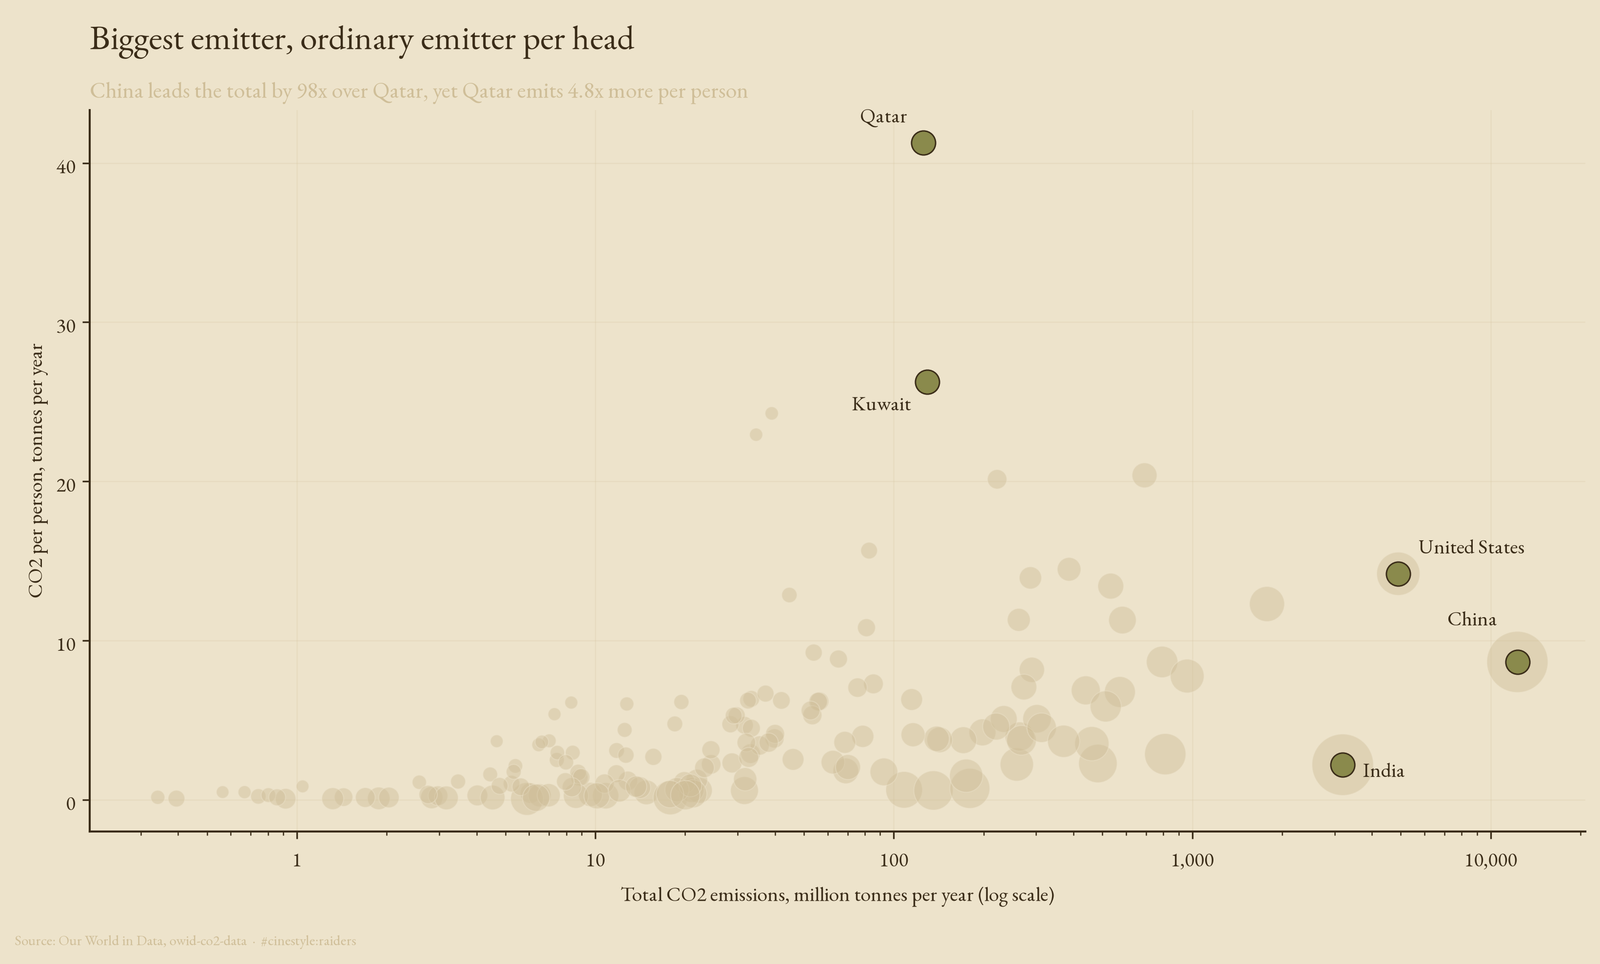
Plot the two axes against each other and the disagreement is geometric. China sits at the far right of the total axis and partway down the per-person axis. Qatar sits at the far left of the total axis and off the top of the per-person one. A country can dominate one measure and barely register on the other. Here is the physical reason: total emissions are per-person emissions multiplied by headcount, so a small, rich, fossil-exporting population lands high on one axis and nowhere on the other. The per-capita number measures a lifestyle, and the total multiplies it by population. They answer different questions, and a debate that does not say which one it means is two debates wearing one coat.
A few countries carry the rest
The other thing the data makes plain is how lopsided the total is. The top 10 emitters account for 71 percent of all CO2 in 2024. The top 20 reach 82 percent. Three countries alone, China, the United States, and India, cross half the world total between them.
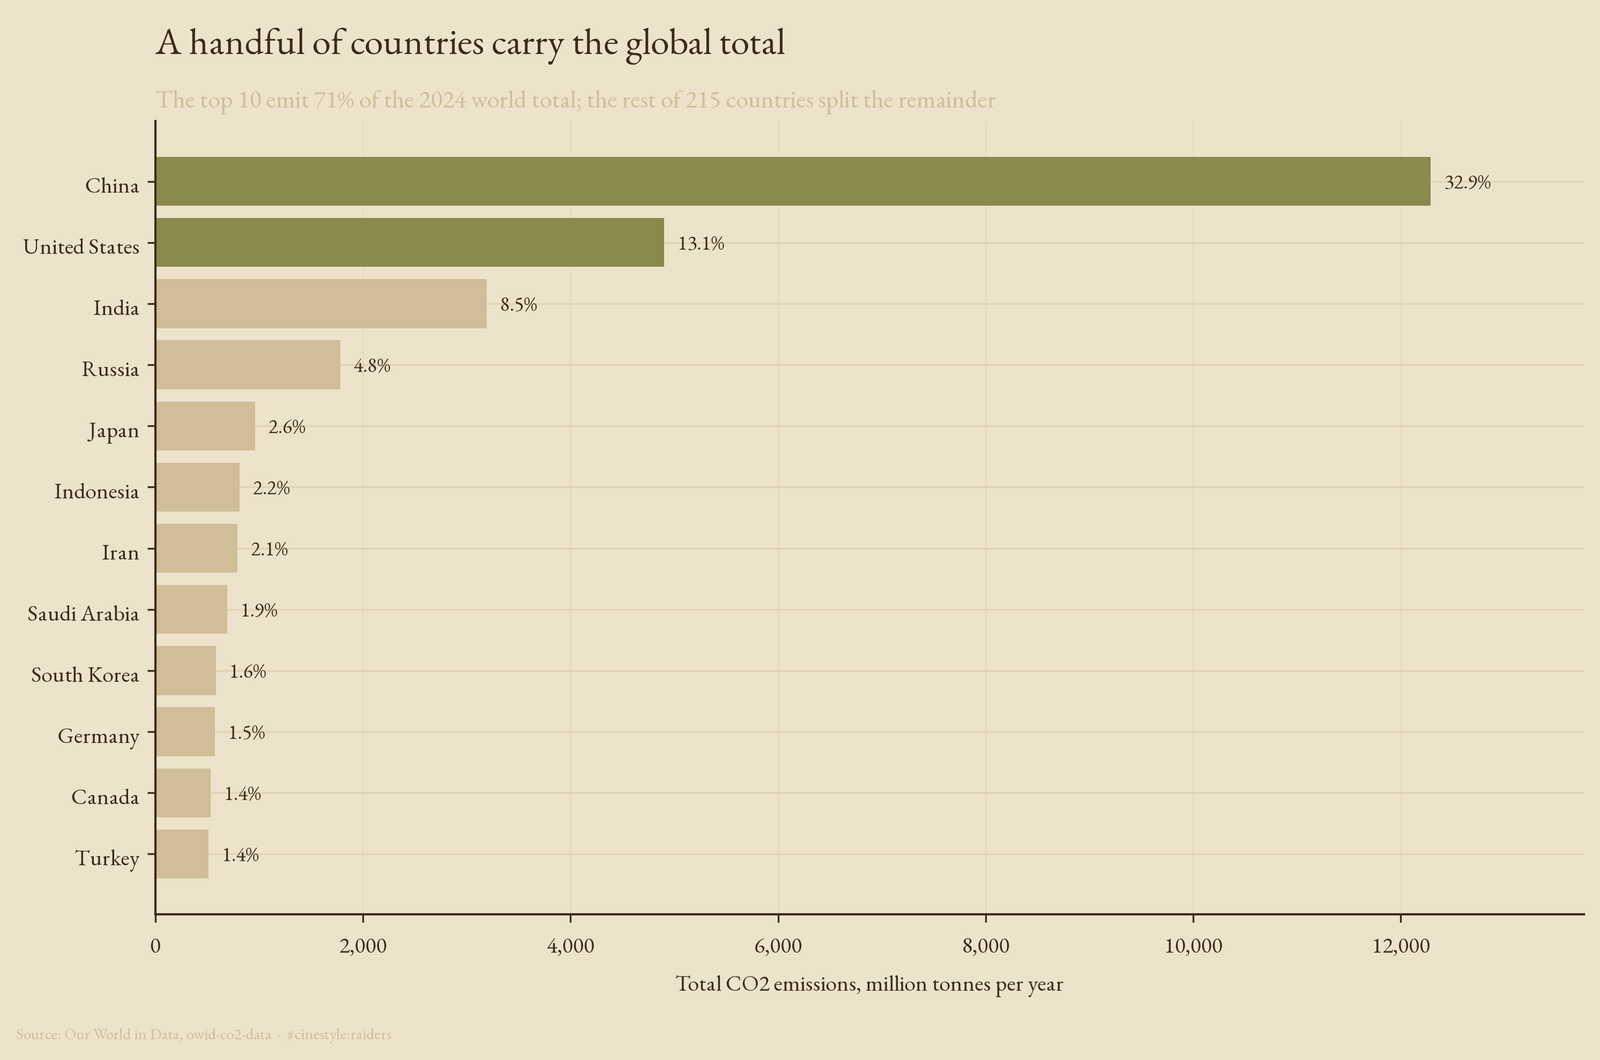
That concentration is the lever and the constraint at once. It means a climate agreement that moves the largest handful moves most of the problem, and it means the 195 countries outside the top twenty, which together emit 18 percent of the total, cannot close the gap on their own. India is the country to watch: third in total at 3,193 million tonnes, yet only 2.2 tonnes a head, about a sixth of the American 14.2. Its total is large because its population is enormous, not because its people emit much. India sits below the world average of 4.6 tonnes; Qatar sits nine times above it.
Russia is the case that fits neither story. It is fourth in total at 1,780 million tonnes and emits 12.3 tonnes a head, close to the American figure. On both axes it is a heavy emitter.
Per person, the Gulf is in its own class
Rank countries by emissions per resident and the list reads like a roster of petrostates. Qatar tops it at 41 tonnes. Kuwait, Bahrain, Trinidad and Tobago, Saudi Arabia, and the United Arab Emirates follow, all above 20 tonnes, all well past the United States.
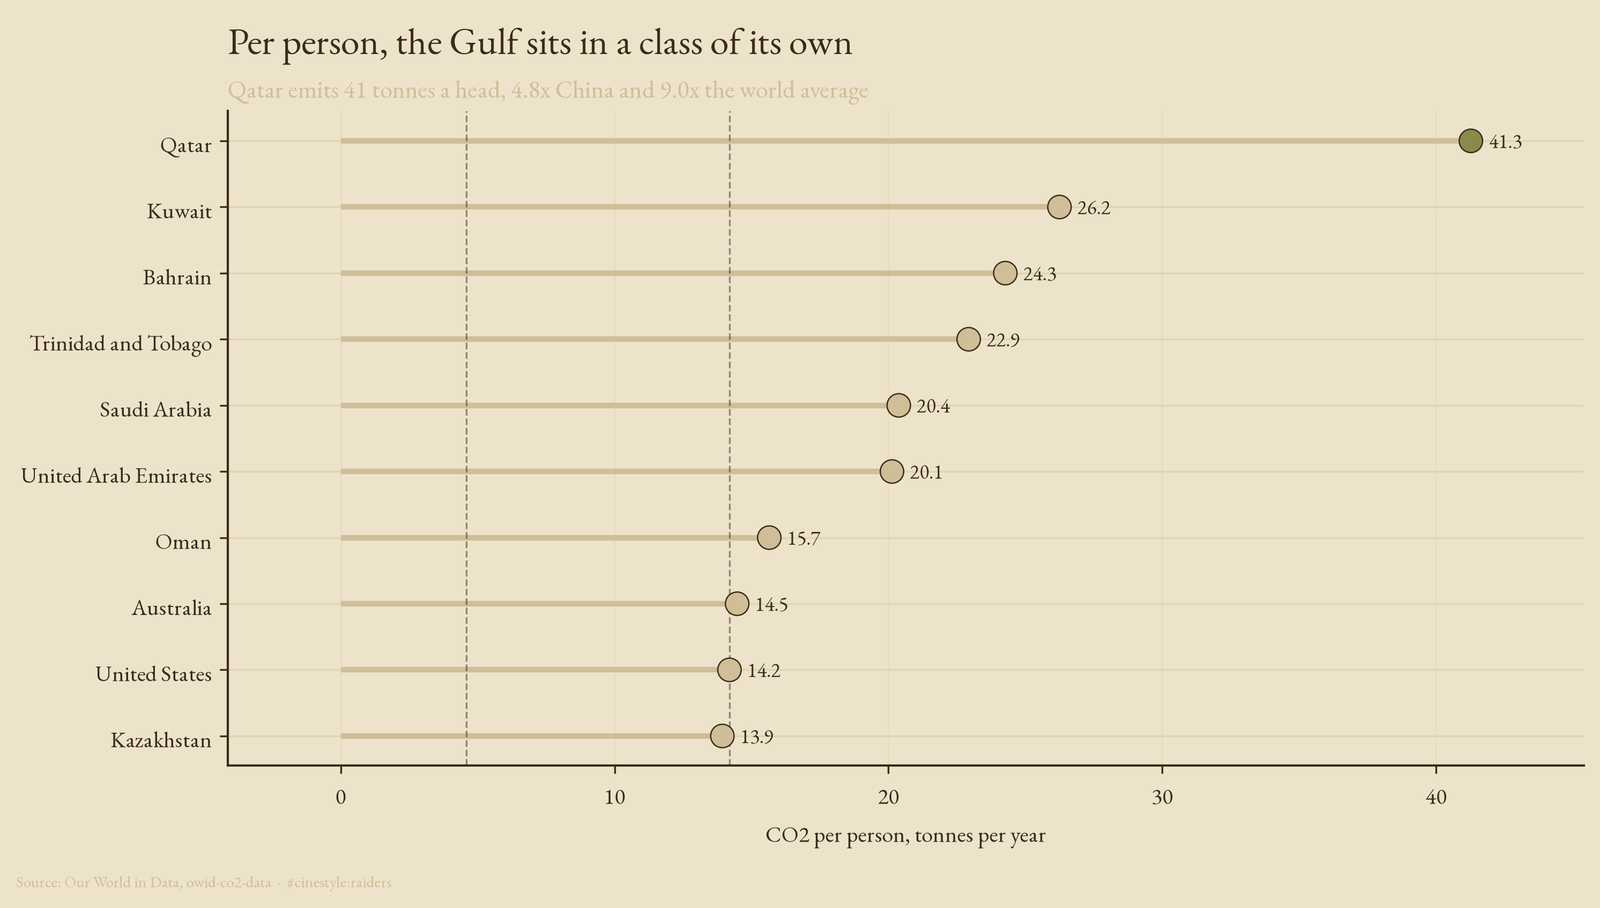
Most of these are small populations sitting on top of large fossil industries. Saudi Arabia is the exception: 692 million tonnes in total, a large emitter by any count, and still 20.4 tonnes a head. The carbon of extracting, flaring, and refining gets divided by very few people, and the per-head number goes vertical. It is the inverse of the India case: a tiny denominator instead of a tiny numerator. Both rankings are correct answers to different questions, and the question hiding inside “who emits the most” is the one worth arguing about.
What these numbers count
These are territorial production emissions: carbon counted where the fuel is burned, not where the product is consumed. A steel beam made in China and built into a German bridge counts as Chinese. Consumption-based accounting shifts a slice of that back onto importers; I did not run it here. The 2024 figures are also recent estimates and will be revised, though a revision is unlikely to reorder the top of either list. In 2024 the biggest total emitter and the biggest per-person emitter are different countries, and counting only one of them is how a debate stays unwinnable.