// article
Bird Strikes on Approach
Birds do not hit planes at cruise. They hit them on approach.
Almost half the wildlife strikes in this dataset, 46.2%, happen on approach. Not climb, not cruise, not the dramatic part. The descent, where the plane is low and slow and pointed at a runway that some airport authority bulldozed into a wetland forty years ago. Add landing roll and takeoff to approach and you have 76.2% of every strike in the set, all of it within a few hundred feet of the ground.
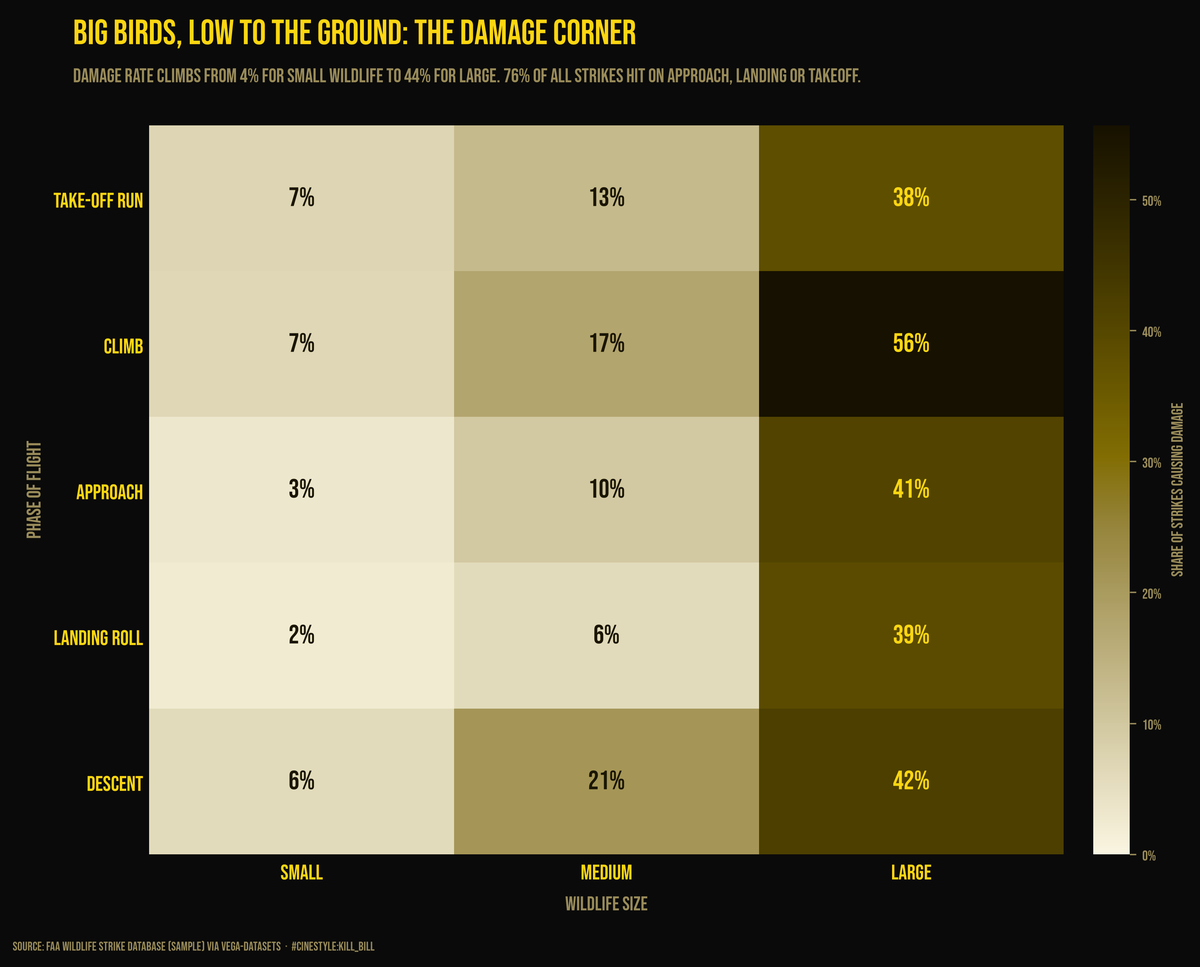
Read that heatmap left to right and the damage rate barely moves. Read it top to bottom and it barely moves. Read it corner to corner, small wildlife on landing roll to large wildlife on climb, and it runs from 2% to 56%. Size is the axis that matters, and the worst cell is a big bird hit on the way up. The rest of this post takes the chart apart one finding at a time.
I pulled the FAA Wildlife Strike Database sample that ships with vega-datasets: 10,000 rows, 14 columns, covering airport, aircraft, phase of flight, wildlife size, a damage category, and repair cost. It is a slice of a much bigger national database, and the slice has a known bias I will get to. Even so, a 10k-row cut tells a clean story, and the story is about altitude.
Low and slow is where it happens
Phase of flight breaks down like this. Approach takes 46.2%. Climb is 19.6%, take-off run 15.9%, landing roll 14.1%. Descent trails at 4.0%, and taxi and parked are a rounding error at 0.2% and 0.1%.
Add the three phases where the aircraft is near the ground and moving slowly, approach, landing roll, and take-off run, and you get 76.2% of every strike in the set. Approach and landing roll together, the two moments closest to the runway, are 60.2%. This sample does not even carry a real cruise bucket.
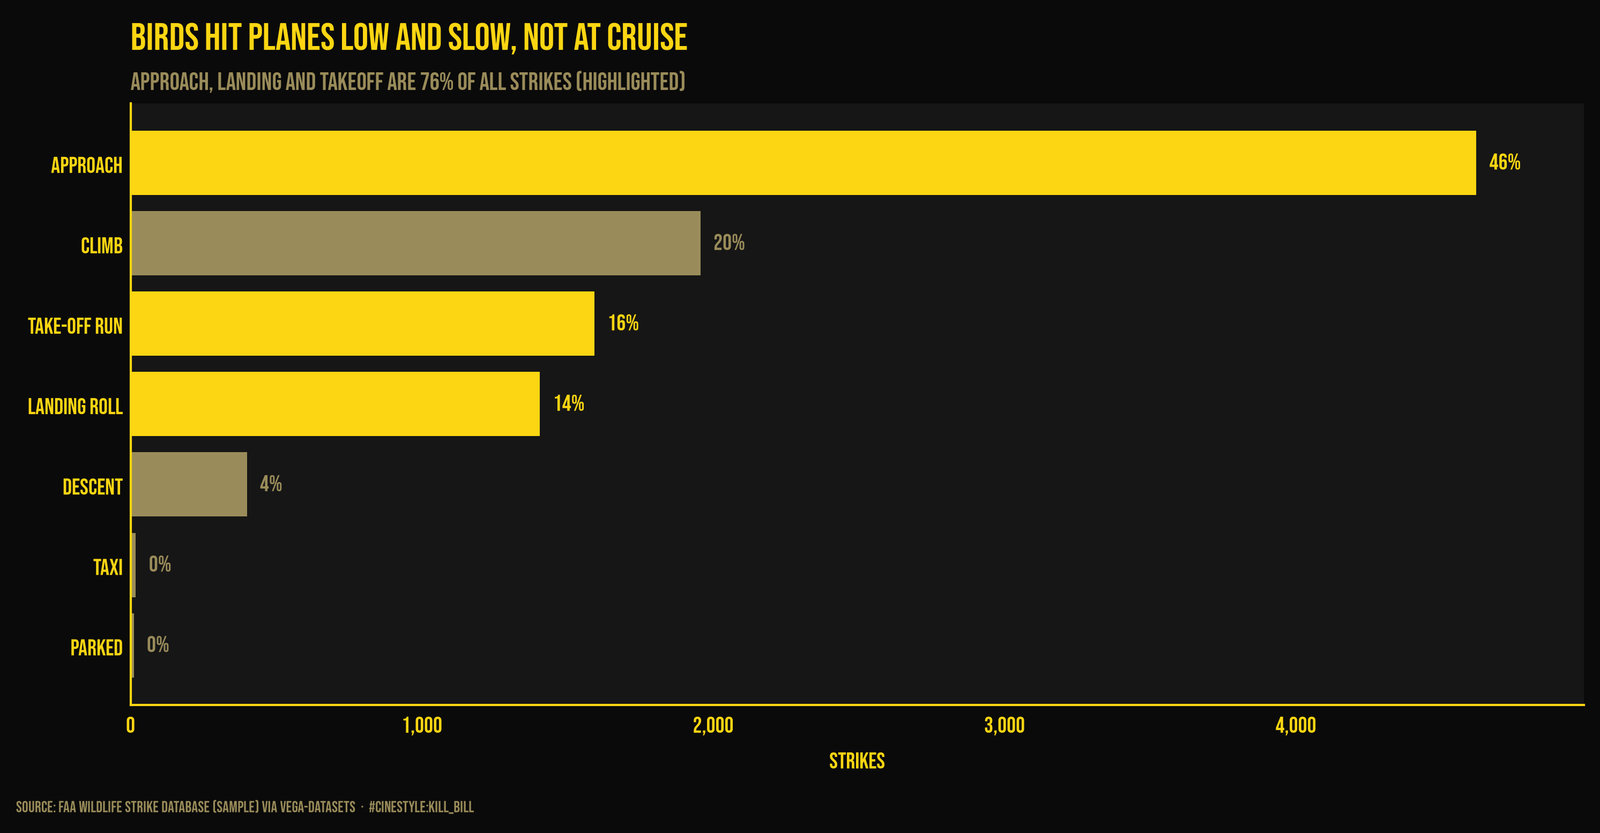
The bar chart makes the lopsidedness obvious, but there is a wrinkle I did not expect. Climb (19.6%) outpaces both take-off run and landing roll individually. I would have guessed takeoff was the bigger killer. The danger is not only the runway itself. It is the whole low-altitude funnel into and out of it, climb-out included.
October is the spike
Parsing Flight Date worked on 100% of rows, so the monthly counts are trustworthy. They climb through summer and peak hard in fall. October is the worst single month: 1,352 strikes, 13.5% of the total. September is right behind at 1,330. The three fall months, September through November, account for 34.0% of all strikes, against just 11.7% for the dead of winter.
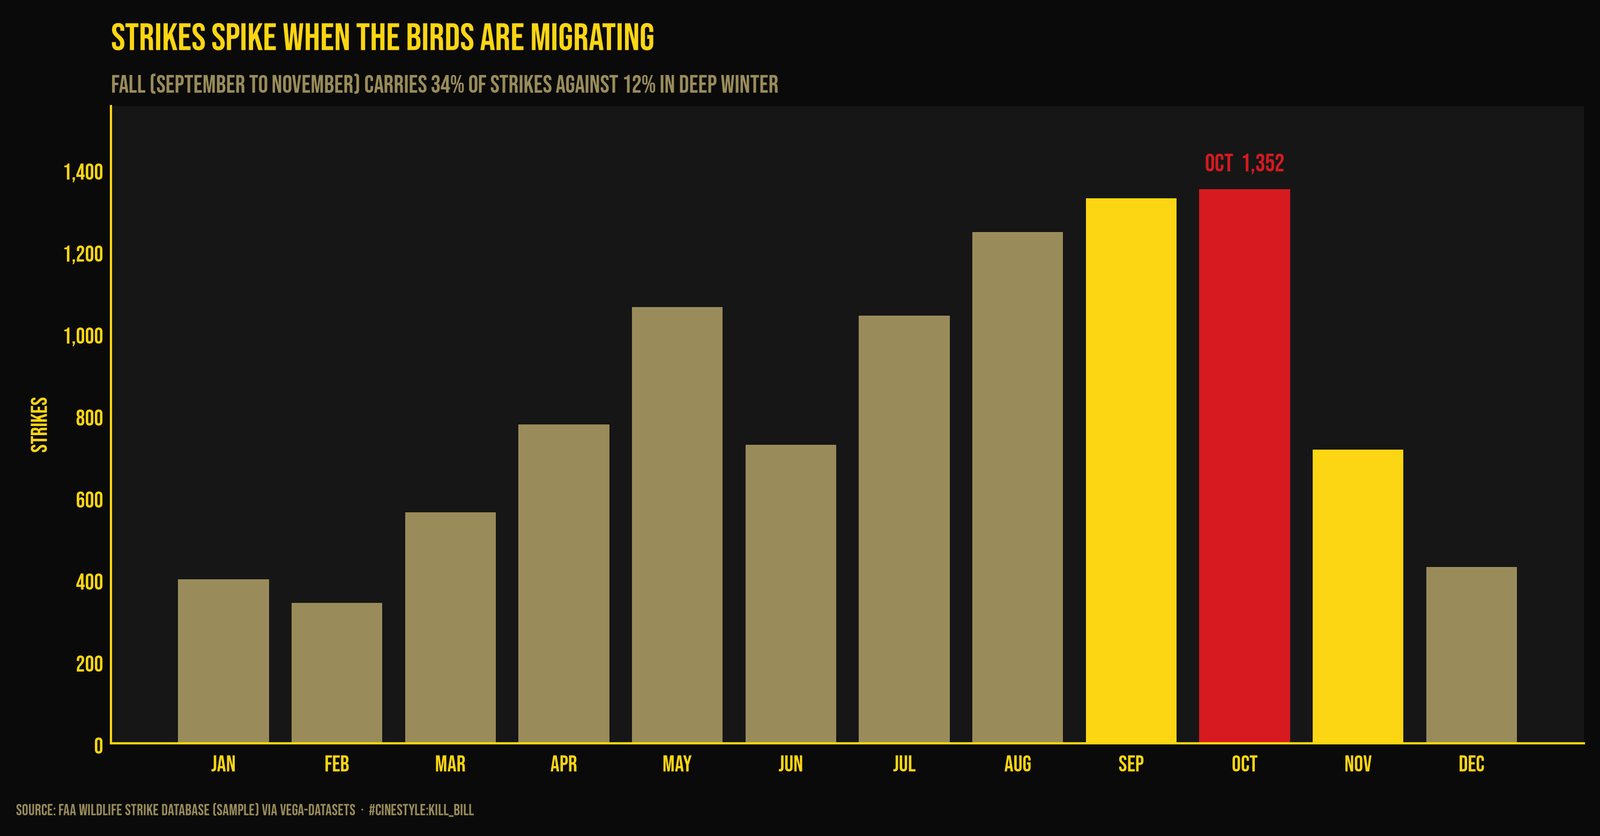
That is fall migration showing up in airframe damage records. Birds move south, and a lot of them move through the same low-altitude airspace planes use. November drops off sharply to 717 even though it is nominally still fall, so the migration window is narrower than the calendar season. Summer stays high too, which I would chalk up to fledglings and sheer traffic volume rather than migration. The calendar season is a label; the birds keep their own schedule.
Most strikes do nothing
Here is the number that reframes the whole risk picture: 89.4% of strikes caused no recorded damage. In the data that is a blank Effect Amount of damage field, but those blank rows carry an average cost near $31 against $112k for a substantial strike, so reading them as none is fair.
Of the rest, Minor (549 strikes) and Medium (186) are small slices, and Substantial damage shows up in just 3.11% of strikes, 311 events out of 10,000.
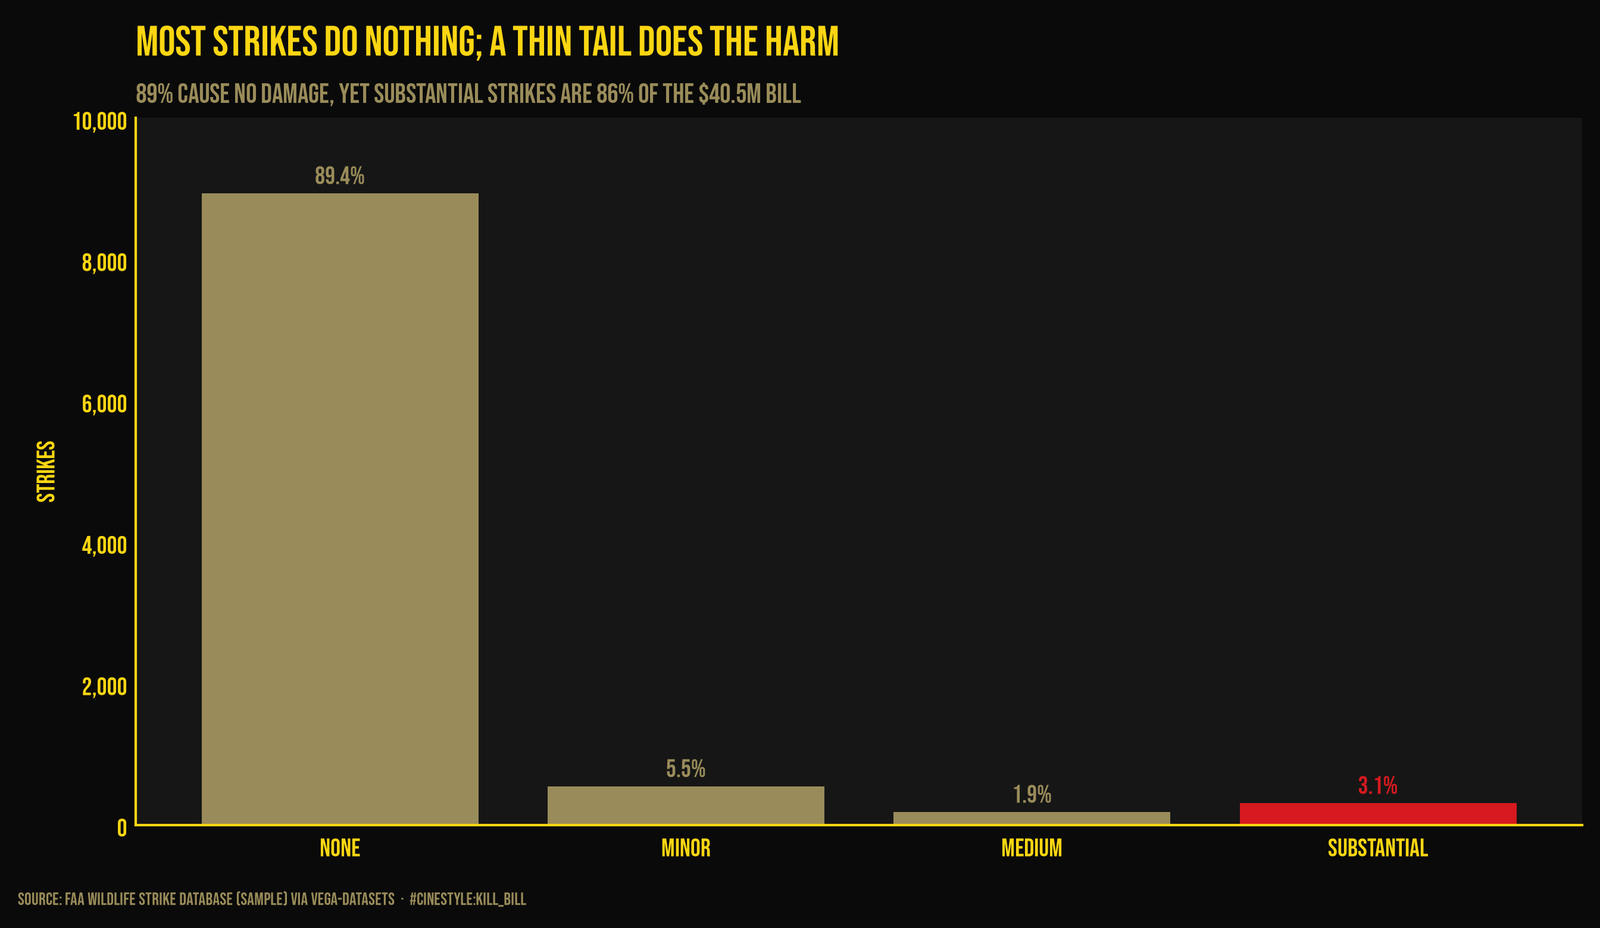
That 3.11% does almost all the harm. Total recorded cost across the sample is $40.5M. The substantial-damage strikes alone account for $35.1M of it, 86.5%. Only 2.09% of rows have any cost attached at all. The distribution is the textbook shape: a wall of harmless events, a thin tail that carries the entire bill.
Bigger bird, worse day
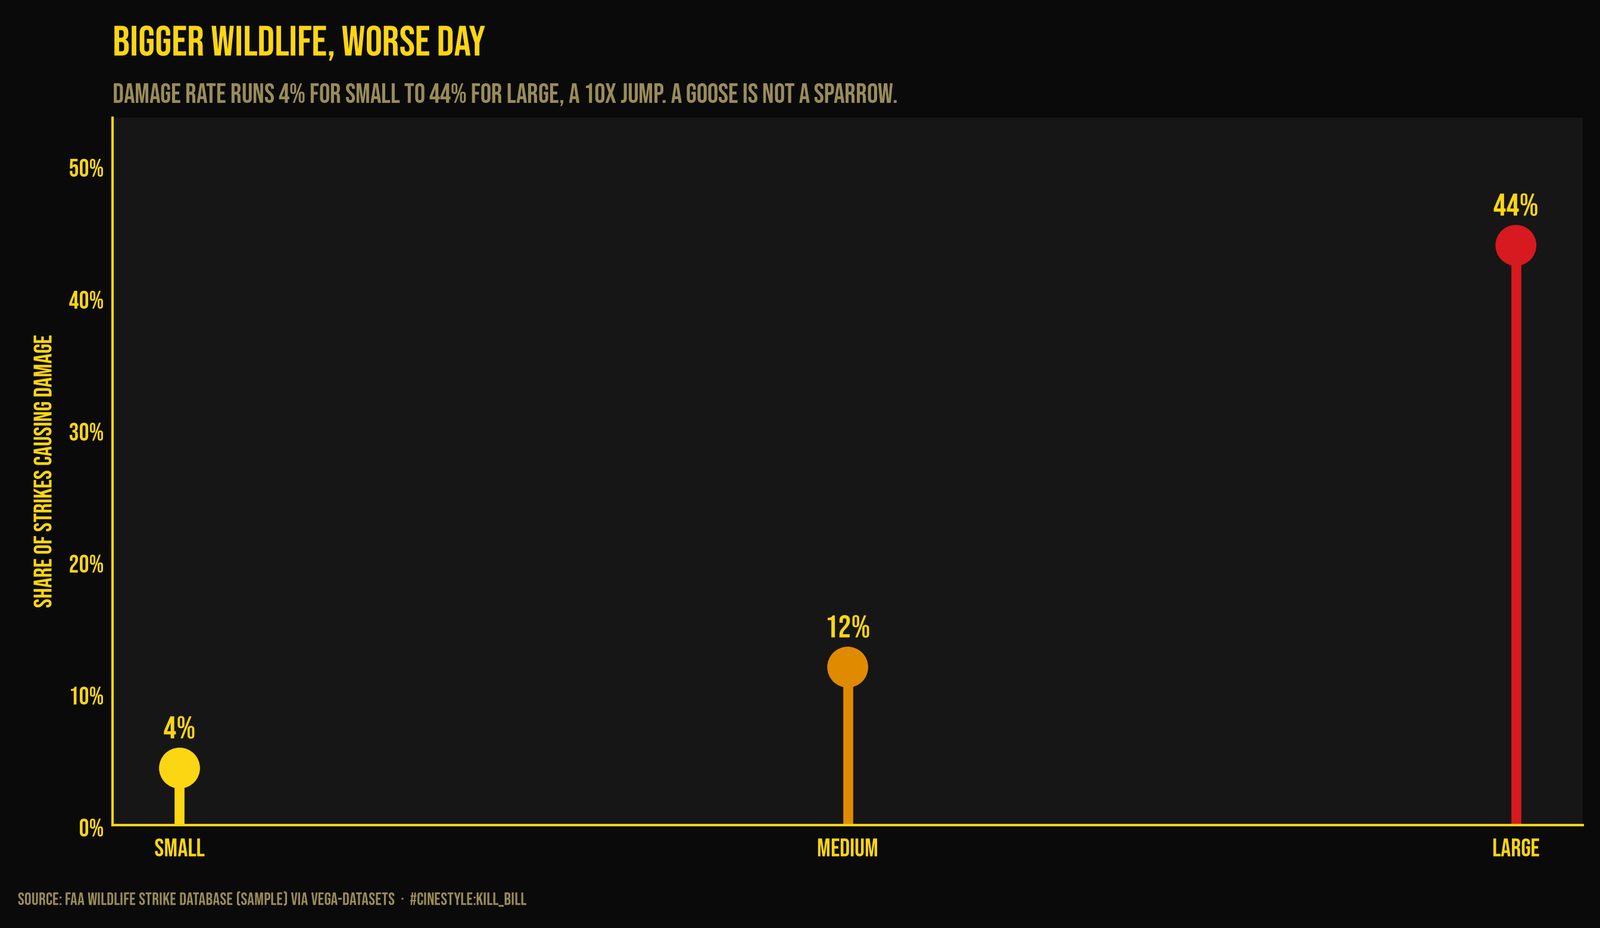
The obvious hypothesis is that size drives damage, and the data backs it cleanly. Among small wildlife, 4.3% of strikes cause damage. Medium jumps to 12.0%. Large hits 44.0%. Nearly half of all large-wildlife strikes do something. A goose is not a sparrow.
Running a chi-square on wildlife size against the full damage category gives a statistic of 1108.9 (dof 10, p near 6e-232), and Cramer’s V comes out to 0.235. That is a moderate association, not an overwhelming one. Size matters a lot, but it is plainly not the only thing in play. Engine ingestion, exactly what gets hit, and luck all live in the gap. The flagship heatmap shows where that gap goes: within the large column, climb (55.7%) beats landing roll (38.8%) by seventeen points, so phase still nudges the rate once size has done most of the work. A tenfold jump in damage rate from small to large is about as honest a signal as a categorical cross-tab gives you.
The caveat that matters
This is a 10,000-row sample, and reporting to the FAA database is voluntary. That biases it in a specific direction: damaging strikes near big, staffed airports get logged; a sparrow that pings a wingtip over a rural field often does not. So the real-world share of harmless strikes is probably higher than 89.4%, and the geographic concentration is partly a map of who files paperwork. The top airports here, Dallas/Fort Worth (908), Barksdale Air Force Base (435), Chicago O’Hare (430), and top states, Texas (1,495), California (890), Louisiana (618), track traffic volume and reporting diligence as much as actual bird density.
None of that dents the core finding. The strikes cluster where the plane is low and slow, they spike when the birds are moving, and the damage hides in a thin 3% tail of big animals hitting at the wrong moment. If you wanted to spend a dollar reducing bird-strike risk, the data says spend it on the approach corridor in October, not the cruise altitude where nobody is getting hit.