// article
Which Models Make Things Up
Which AI models make things up the most
Give a language model a document and ask it to summarize, and most of the time it stays faithful to the page. Sometimes it adds a fact the document never stated, and it states that fact with the same confidence as the real ones. Vectara has been measuring exactly this, one model at a time, and publishing the scores. On the day I pulled the board it held 105 models, and the gap between the most faithful and the least was larger than I expected.
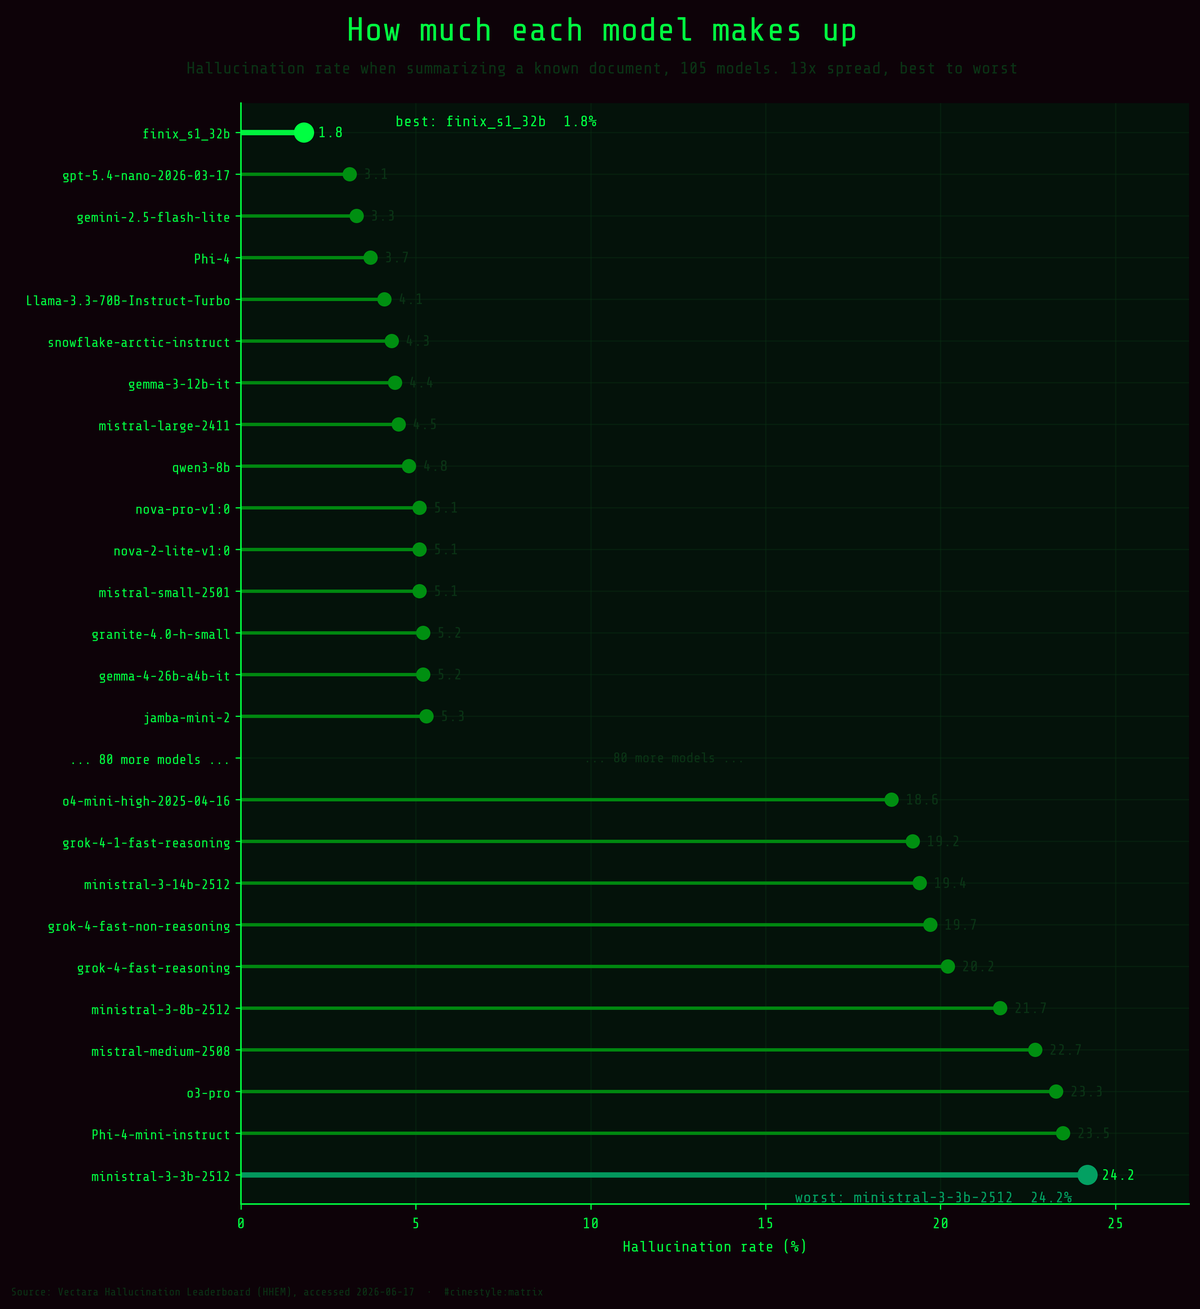
The cleanest model on the board, antgroup/finix_s1_32b, makes something up 1.8% of the time. The worst, mistralai/ministral-3-3b-2512, does it 24.2% of the time. Same task, same grader, a 13x spread.
A word on what the board is before any conclusions. Vectara runs each model through a fixed summarization task and scores the output with HHEM, their factual-consistency model, on documents where the ground truth is known. The hallucination rate is the share of summaries that introduce a claim the source does not support. The board is a snapshot that is rerun as new models ship, so the names and the order move. Everything here is from the version accessed 2026-06-17, parsed straight from the table in the project README. Read it as a reading from one day, not a permanent ranking.
The spread is wide, but the top of the board is crowded
The headline number is the 13x ratio between best and worst. The more useful number is the shape of the distribution. Median hallucination rate across the 105 models is 9.6%, the mean is 10.2%, and the two sitting that close says the field is not badly skewed by a handful of disasters.
The leaders, though, are packed just behind the winner. No other model sits within a full point of the best score, and only three others sit within two points. The cleanest tenth of the board, twelve models, all come in at or under 5.1%. Below that the rate climbs steadily through the long middle and only blows out in the last stretch, where eleven models, a mix of reasoning variants and small or mid-size models, all clear an 18.6% rate and drag the floor down toward 24%.
So the practical read is not “pick the single best model.” It is “the top tenth is a tier, and most of that tier is interchangeable on this metric.” Inside the tier, rates run from 1.8% to 5.1%, and a single day’s snapshot cannot rank models that close together with any confidence. The difference between the top tier and the bottom tier is a model that invents something in roughly one summary out of four.
Does refusing to answer count as not lying?
The obvious cheat for a hallucination benchmark is to refuse. A model that declines half the prompts cannot hallucinate on the ones it skipped. So the first thing I checked was whether the clean scores are bought with silence.
They are not. Across all 105 models the correlation between hallucination rate and answer rate is 0.031, which is to say none. Median answer rate on the board is 99.5%. The overwhelming majority of these models answer almost everything, and the clean ones answer just as much as the messy ones.
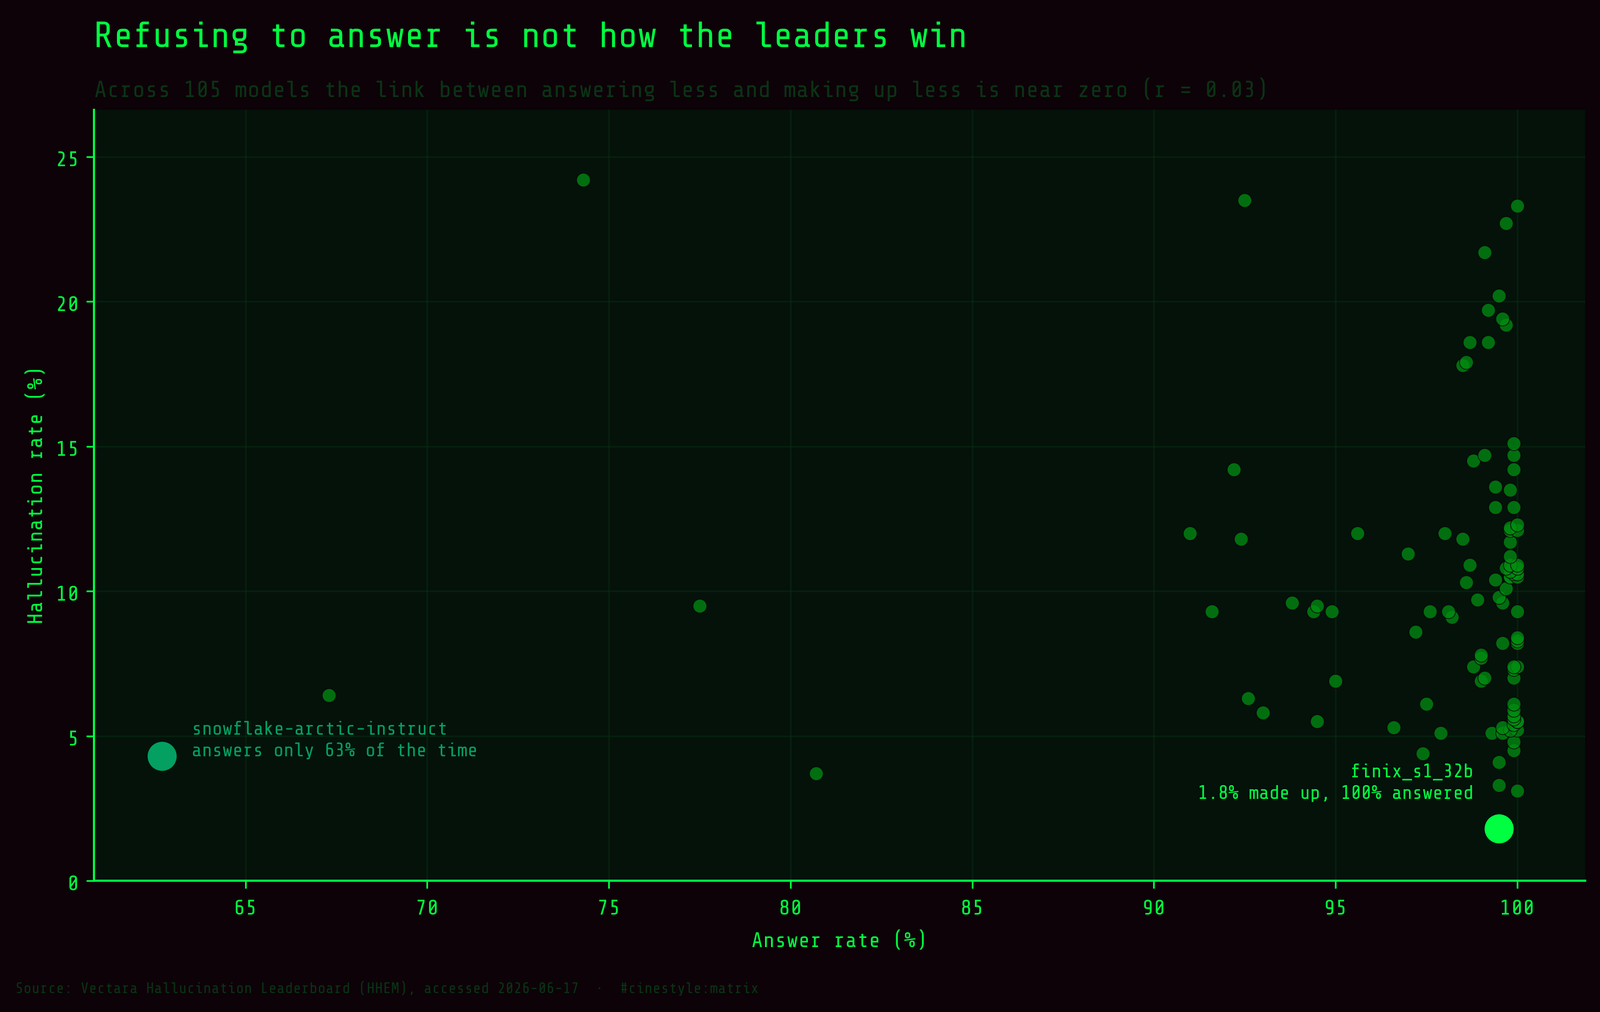
The picture makes the independence obvious. Almost every point stacks up against the right wall at near-total answer rates, and within that wall the vertical spread, the part that matters, has nothing to do with horizontal position. Only five models answer less than 90% of the time. The biggest refuser, snowflake/snowflake-arctic-instruct, answers just 62.7% of prompts, and its reward for all that caution is a 4.3% hallucination rate, inside the top tier. Caution got it there, but eight of the other eleven top-tier models got there while answering at least 99% of the time.
On this board, faithfulness and willingness to answer are separate dials: the good models answer everything and still stay on the page.
The vendor pattern is real, and it is not who you would guess
Group the board by the org prefix on each model name and a pattern shows up that the marketing does not prepare you for. Restricting to the fourteen vendors with at least three ranked models so the averages mean something:
- Amazon: 5.5% mean across 4 models
- Meta: 6.7% mean across 3 models
- DeepSeek: 7.2% mean across 6 models
- Google: 7.9% mean across 12 models
- Qwen: 8.7% mean across 11 models
- Cohere: 9.2% mean across 4 models
- AI21: 9.9% mean across 3 models
- Zhipu: 10.0% mean across 5 models
- MiniMax: 11.3% mean across 3 models
- Anthropic: 11.3% mean across 9 models
- OpenAI: 11.5% mean across 19 models
- Mistral: 14.1% mean across 9 models
- Moonshot: 14.3% mean across 3 models
- xAI: 16.5% mean across 5 models
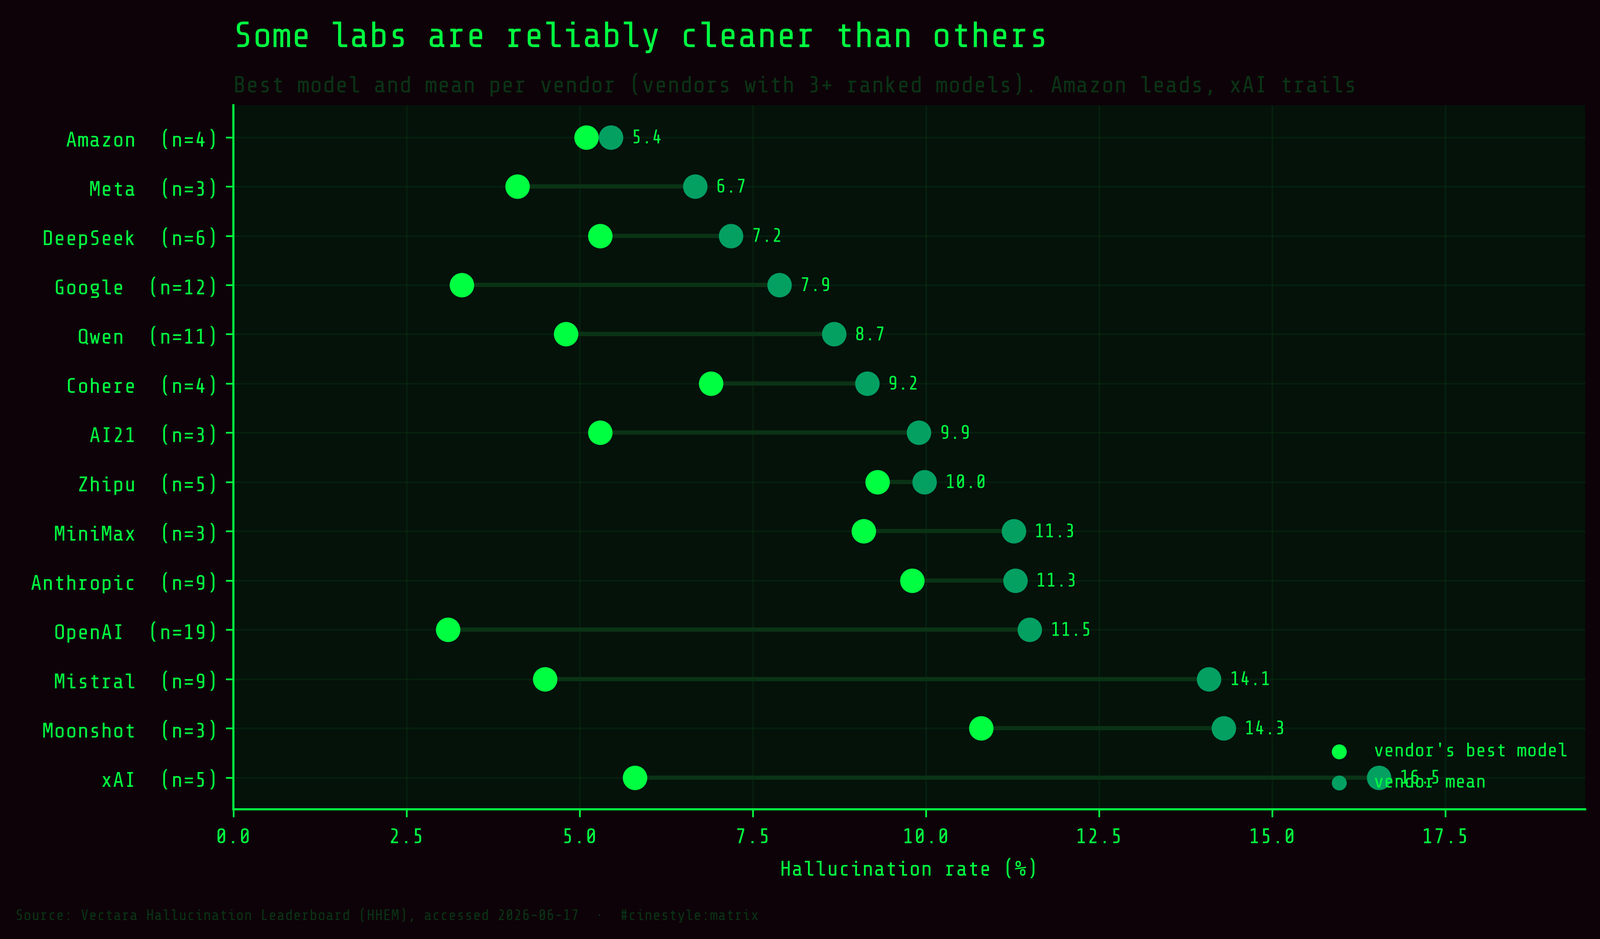
Amazon’s Nova family leads on the average, and the labs with the loudest frontier reputations sit in the middle of the pack on this particular task. The caveat is built into the chart, and it is the reason I drew best and mean as two separate dots. OpenAI shows the problem plainly: its best model scores 3.1%, near the very top of the whole board, while its mean is dragged to 11.5% by nineteen entries that include high-reasoning and minimal-effort variants scoring far worse. A vendor average is a portfolio statistic, not a verdict on the flagship.
xAI has the widest gap of all, a best model at 5.8% against a 16.5% mean, and its median of 19.2% is worse still, which tells you the bad scores are the rule for that set and not one outlier. Reputation and faithfulness are not the same axis, and this benchmark only measures the second one.
What this does and does not tell you
This is one task, summarization with a known source, scored by one judge model. It does not measure reasoning, coding, or open-ended factual recall, and a low score here does not certify a model as truthful in general. It certifies that when handed a document, the model tends to stay on it.
Read it that way and it is useful. If your application feeds a model source text and asks for a faithful condensation, retrieval-augmented generation, document QA, summarizing a ticket thread, this is close to the exact thing you care about, measured directly. The 13x spread is real and it is available to you for free at inference time, just by choosing the right model off the top tier.
I came in expecting the safe models to be the cautious ones, the models that hedge and decline. The data says the opposite. The faithful models answer everything and simply do not make things up, and the gap between them and the bottom of the board is the difference between a tool you can trust with a document and one you cannot.